
Elliott Wave chart analysis for the S&P 500 for 1st July, 2011. Please click on the charts below to enlarge.
Last analysis main hourly wave count expected price to continue to rise to 1,337.06. Friday’s session saw price reach 3.95 points above this target.
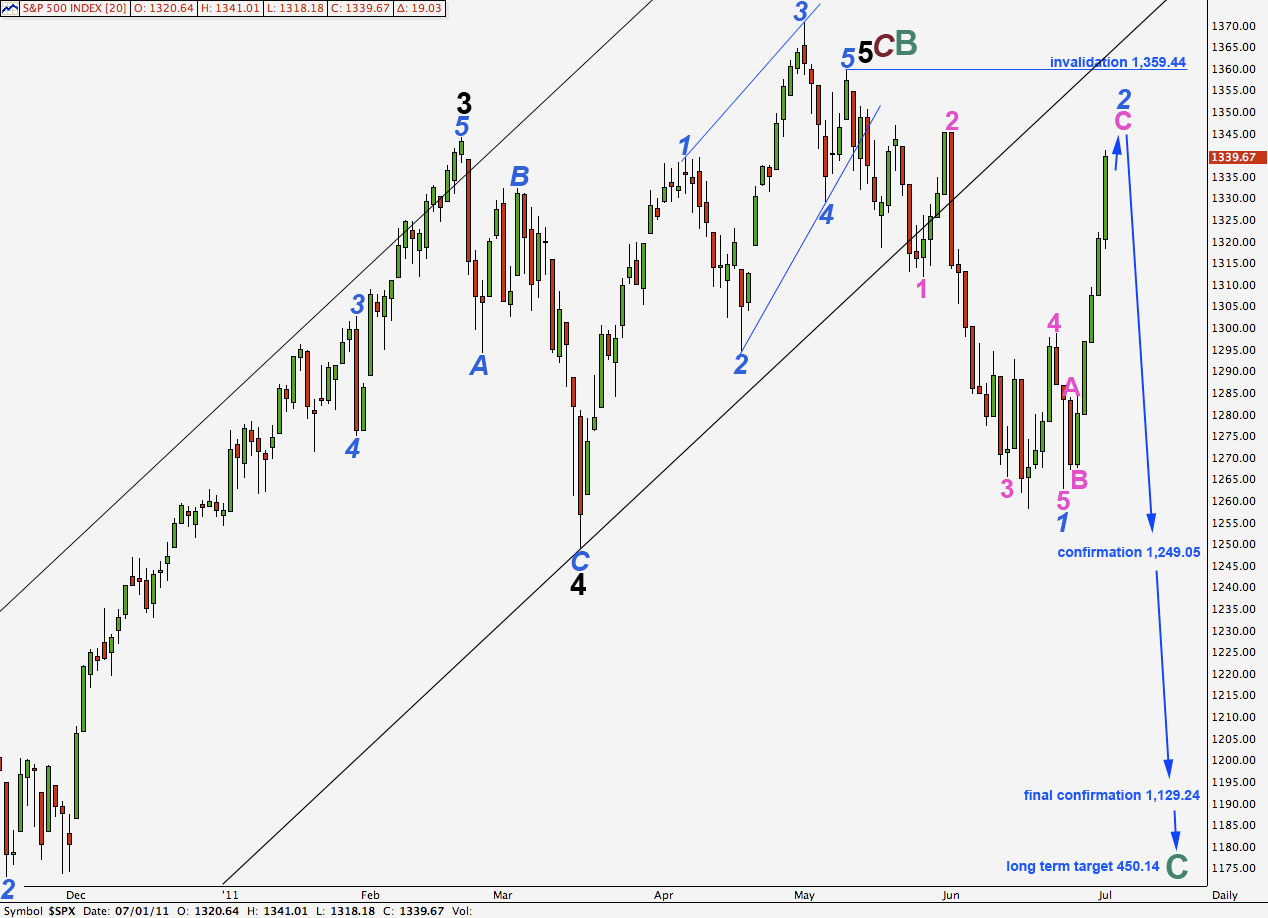
We would expect wave 2 blue to be most likely a deep correction and its subdivisions should be clearly seen on the daily chart. I have adjusted the wave count within wave 2 blue and the first wave upwards may have been wave A pink; this labeling sees wave 2 blue as a three on the daily chart.
Wave 2 blue may not move beyond the start of wave 1 blue. This wave count is invalidated with movement above 1,359.44.
Movement below 1,129.24 would confirm this wave count at cycle degree and would invalidate our alternate daily wave count.
This wave count requires one last wave at green degree upwards to complete an impulse for wave C pink of wave 2 blue zigzag.
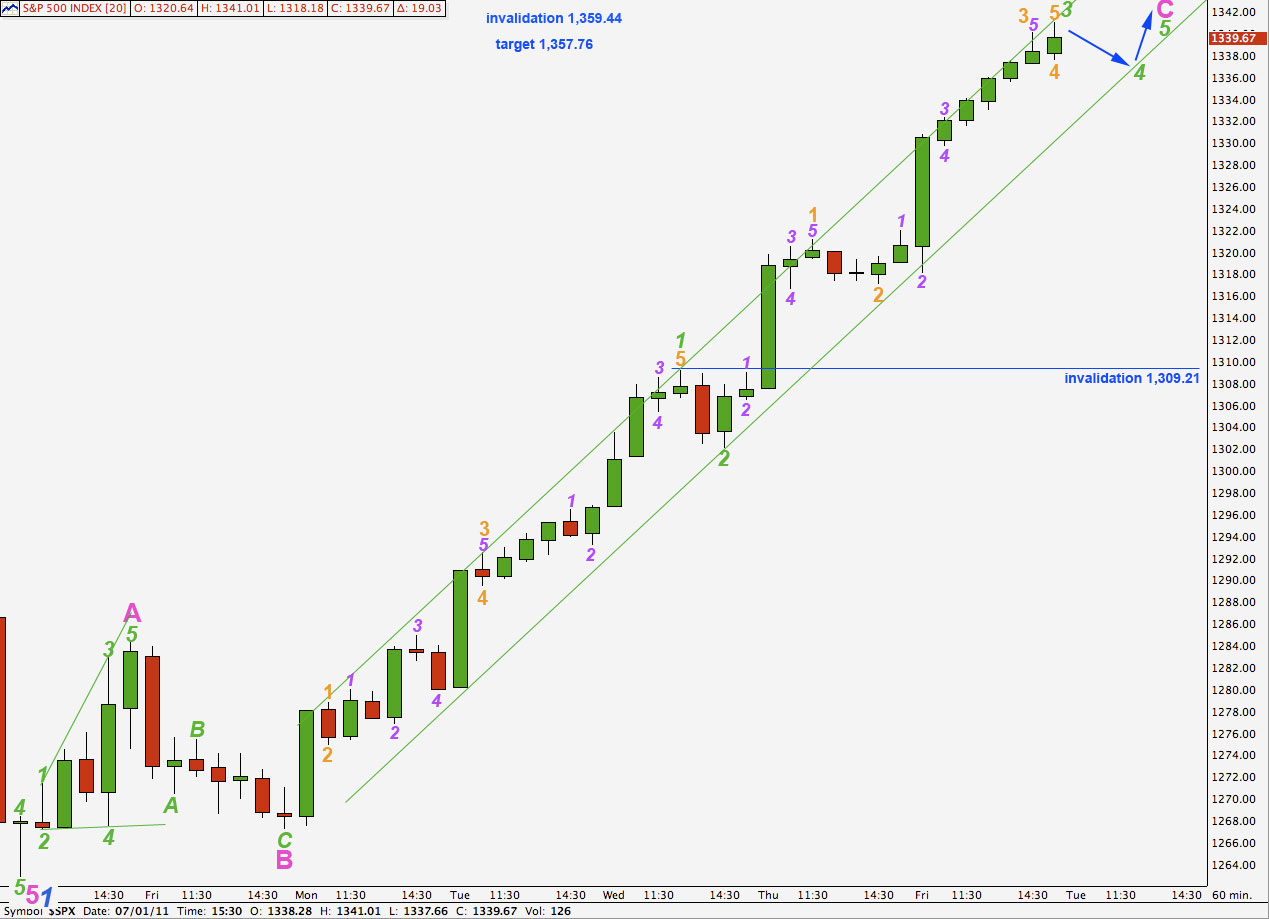
Wave 3 green is 3.11 points short of equality with wave 1 green. This limits wave 5 green to come to no longer than 38.86 points in length.
Ratios within wave 1 green are: wave 3 orange is 1.18 points short of 1.618 the length of wave 1 orange and wave 5 orange is 0.98 points longer than 1.618 the length of wave 1 orange.
Ratios within wave 3 green are: wave 3 orange has no fibonacci ratio to wave 1 orange and wave 5 orange is exactly 0.146 the length of wave 3 orange.
Wave C pink has passed 2.618 the length of wave A pink. The next fibonacci ratio is 4.236 the length of wave A pink which would be achieved at 1,357.76.
Wave 4 green should find strong support at the lower edge of the small parallel channel containing wave C pink impulse. Wave 4 green is likely to end about the fourth wave of one lesser degree at 1,337.66.
Wave 4 green may not move into wave 1 green price territory. This wave count is invalidated with movement below 1,309.21.
When we can see at least one full hourly candlestick below this parallel channel then we shall have some indication that wave C pink and wave 2 blue are complete and the next wave downwards should then have begun.
If price rises above 1,359.44 then we shall use the alternate daily chart below.
Alternate Daily Wave Count.
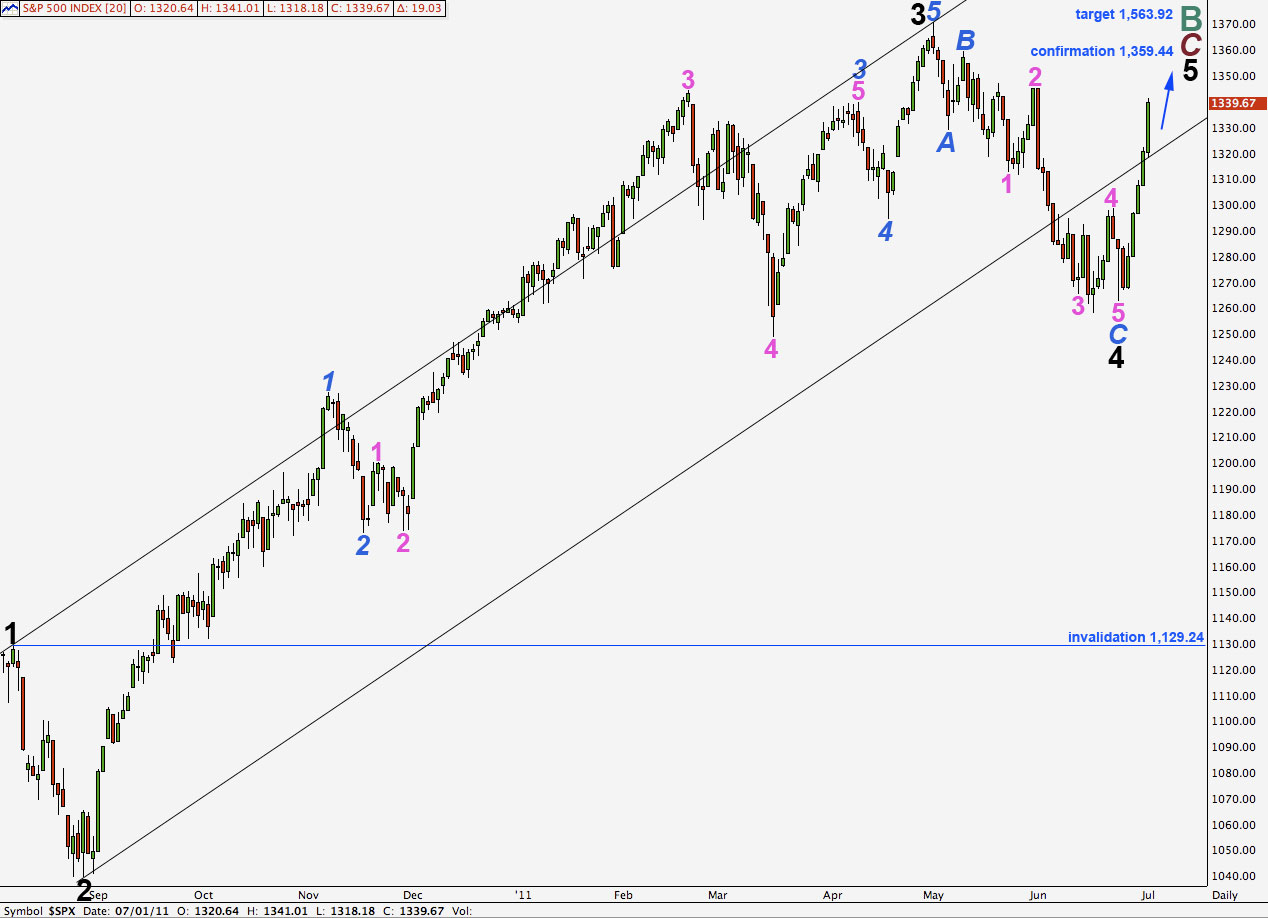
Price has moved strongly back into the parallel channel for this wave count, increasing its probability.
Movement above 1,359.44 would confirm this wave count. At that stage we should expect a continuation of steady upwards movement for weeks if not another month or two towards the target 1,563.92, where primary wave C will reach equality with primary wave A.
Importantly, this wave count allows for new all time highs for the S&P 500, and indeed this would be fairly likely.
Eventually cycle wave C would follow to take price to new lows.
Lara,
If we are nearing the end of Blue 2, then I would assume the next move down should be very impulsive. If it is not, and we see only three waves down, can we then assume that your Pink C is actually Blue 1 up of Minor 5.
Thanks,
Peter
Yes, that would be a fair assumption.
The subdivisions on the hourly chart would be the same, except instead of A-B-C we would expect it would be 1-2-3 pink.