
Elliott Wave chart analysis for the S&P 500 for 29th June, 2011. Please click on the charts below to enlarge.
Upwards movement invalidated the main wave count and confirmed the alternate.
We must also now more seriously consider the alternate daily chart and so it is presented again here at the end of today’s analysis. We will now have to consider it each day alongside this main wave count.
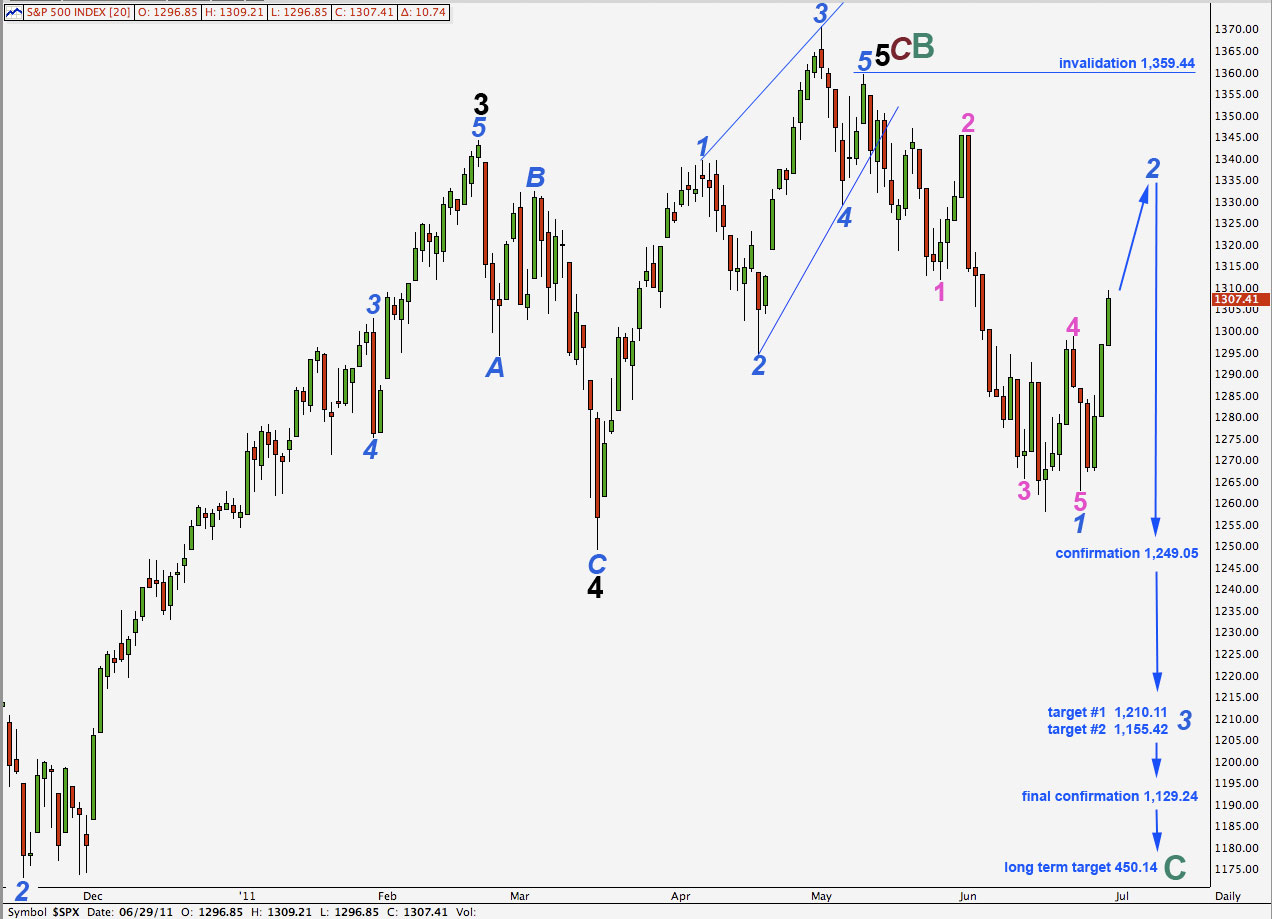
Upwards movement may be a second wave correction. Wave 2 blue may not move beyond the start of wave 1 blue. This wave count is invalidated with movement above 1,359.44.
We would expect wave 2 blue to be most likely a zigzag and most likely a deep correction.
Even though this is the early stage of cycle wave C downwards we may still see deep second wave corrections; we would not expect cycle wave C to be a sheer drop all the way to its end at about 450.14. In fact, the first correction clearly visible on the daily chart after the high at 1,576.09, in October 2007, was a deep 73% of the first five wave structure downwards. If cycle wave A exhibited deep corrections on its way down, we cannot rule out cycle wave C doing so as well. In fact, we should expect it to behave the same as the “credit crunch” (cycle wave A).
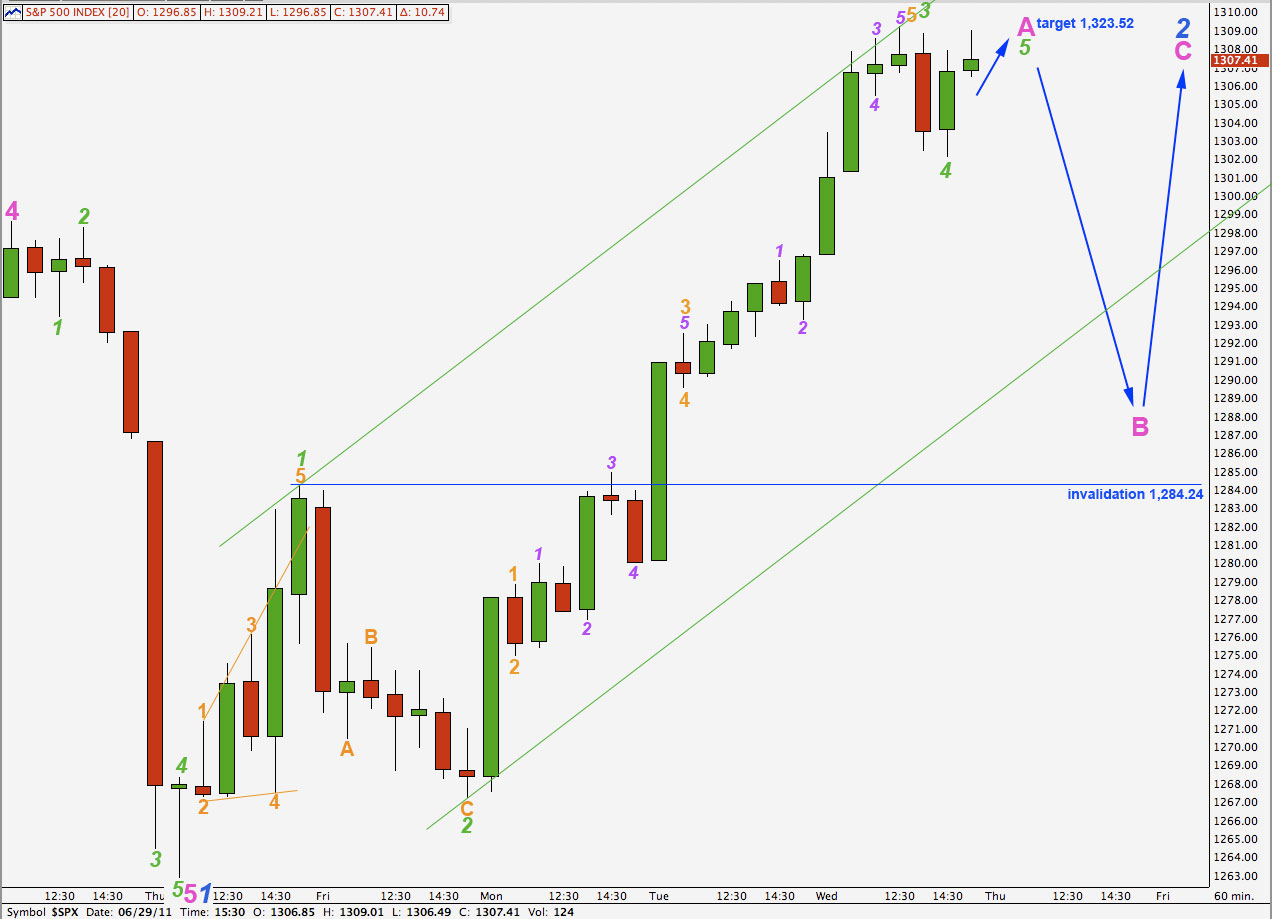
This hourly wave count would be the same for the alternate and this main wave count in the short term. Both would be completing a first impulse upwards.
Within wave A pink of wave 2 blue so far wave 3 green is just 0.33 points longer than 1.618 the length of wave 1 green. Wave 5 green would reach equality with wave 1 green at 1,323.52 and this is our target for tomorrow’s upwards movement to end. Wave 5 green may end about the upper trend line drawn here.
When wave A pink is complete we should expect a B wave to break through this parallel channel and take price lower in (most likely) a three wave structure or a triangle.
Wave B pink may not move beyond the start of wave A pink below 1,268.34.
In the interim, if wave 4 green is not over (this may have been only wave A within wave 4 green) any further downwards movement of wave 4 green may not move into wave 1 green price territory. This wave count is invalidated with movement below 1,284.24.
Ratios within wave 3 green are: wave 3 orange is 1.18 points short of 1.618 the length of wave 1 orange and wave 5 orange has no fibonacci ratio to either of 1 or 3 orange.
Ratios within wave 3 orange of wave 3 green are: wave 3 purple is just 0.13 points short of 1.618 the length of wave 1 purple and wave 5 purple is 0.46 points short of 1.618 the length of wave 3 purple.
Ratios within wave 5 orange of wave 3 green are: wave 3 purple is 0.35 points longer than 2.618 the length of wave 1 purple and wave 5 purple is 0.25 points longer than 0.146 the length of wave 3 purple.
On a 5 minute chart wave 4 green has a corrective count of 11. It may be a complete zigzag. Alternately, this may be wave A orange within wave 4 green which may continue further as a flat or a triangle. If it does continue further we would expect it to be mostly sideways and not to move significantly lower.
One final wave upwards will complete this impulse.
Alternate Daily Wave Count.
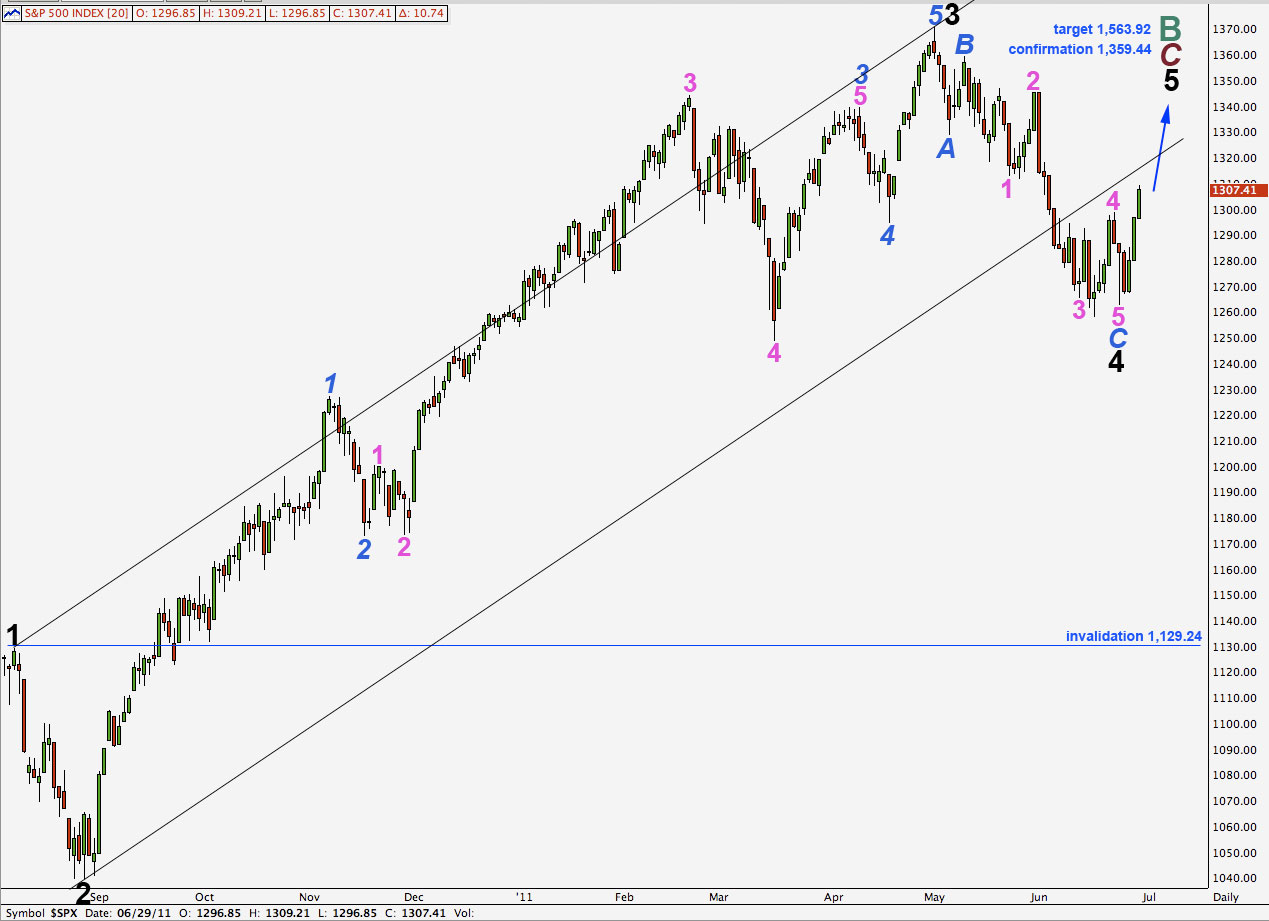
This wave count remains valid. It does not fit the trend channel nearly as well as the main wave count does for upwards movement, but the middle of third waves do sometimes overshoot the channel and fourth waves also may overshoot the channel and therefore this wave count could be correct.
If price moves strongly back into this parallel channel then this wave count will increase in probability.
Movement above 1,359.44 would invalidate our main wave count and confirm this alternate. At that stage we should expect continuing upwards movement towards 1,563.92 where primary wave C (maroon) would reach equality with primary wave A within this cycle wave B zigzag.
Importantly, this wave count allows for new all time highs for the S&P 500, and indeed this would be fairly likely.
Eventually cycle wave C would follow to take price to new lows.
Lara,
Don’t know if you watching the market right now, but do you think Green 5 has ended yet.
Also, given your USD count, isn’t a Blue 2 count more likely than the beginning of Minor 5.
Thanks,
Peter