
Elliott Wave chart analysis for the S&P 500 for 28th June, 2011. Please click on the charts below to enlarge.
We had expected some upwards movement from the S&P yesterday, but it has comfortably exceeded the target by 8.19 points, coming very close to the invalidation point.
We have two wave counts today.
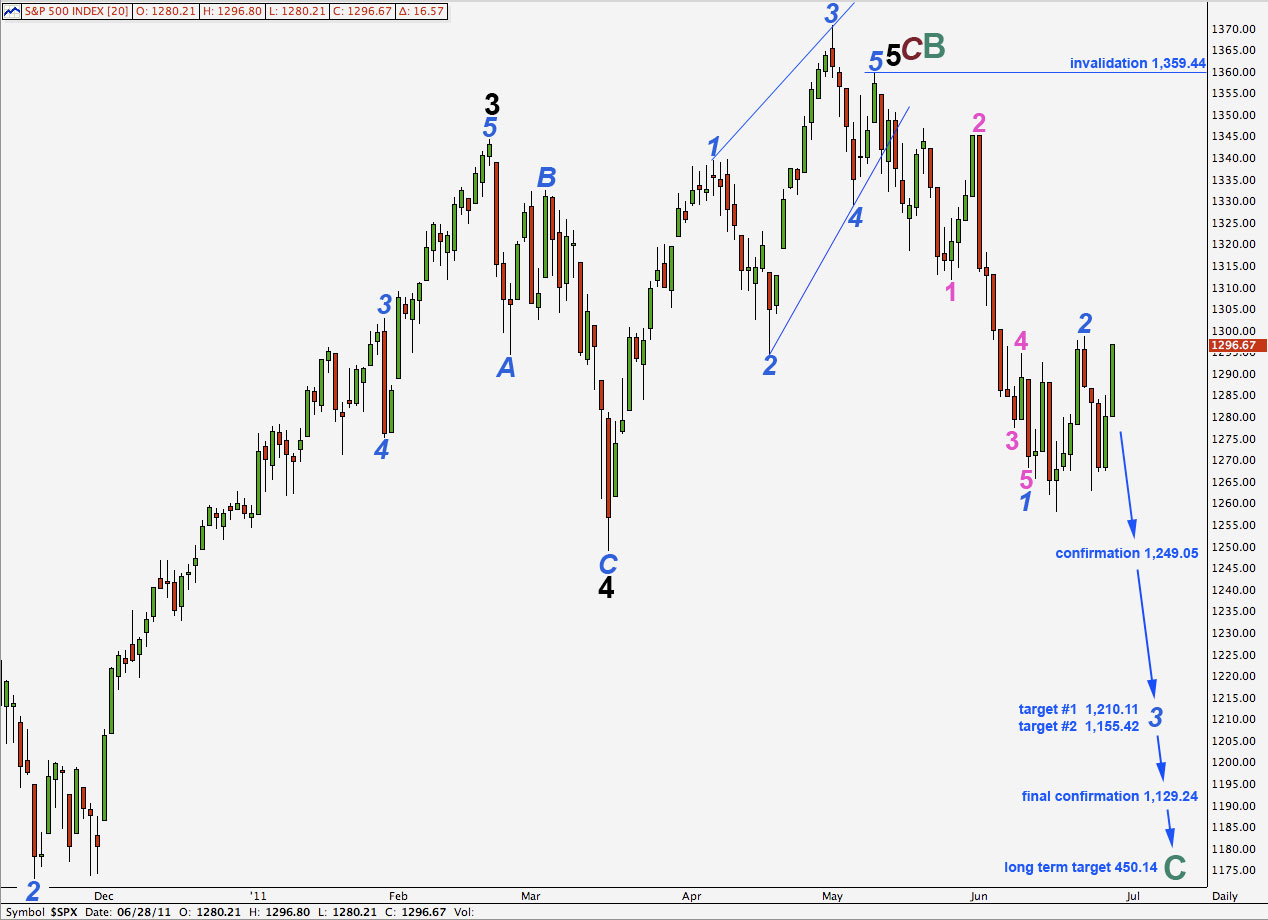
Our mid term target is 1,210.11 where wave 3 blue will reach equality in length with wave 1 blue. At 1,155.42 wave 3 blue would reach 1.618 the length of wave 1 blue. This would be a more likely target. This target is at least two weeks away.
Movement below 1,129.24 will provide strong confirmation that the S&P 500 is in a bear market which should last at least a year, if not several. At that stage the alternate daily chart presented at the end of this analysis will be invalidated.
The long term target at 450.14 is where cycle wave C will reach equality with cycle wave A within a super cycle zigzag. This target is probably over a year away.
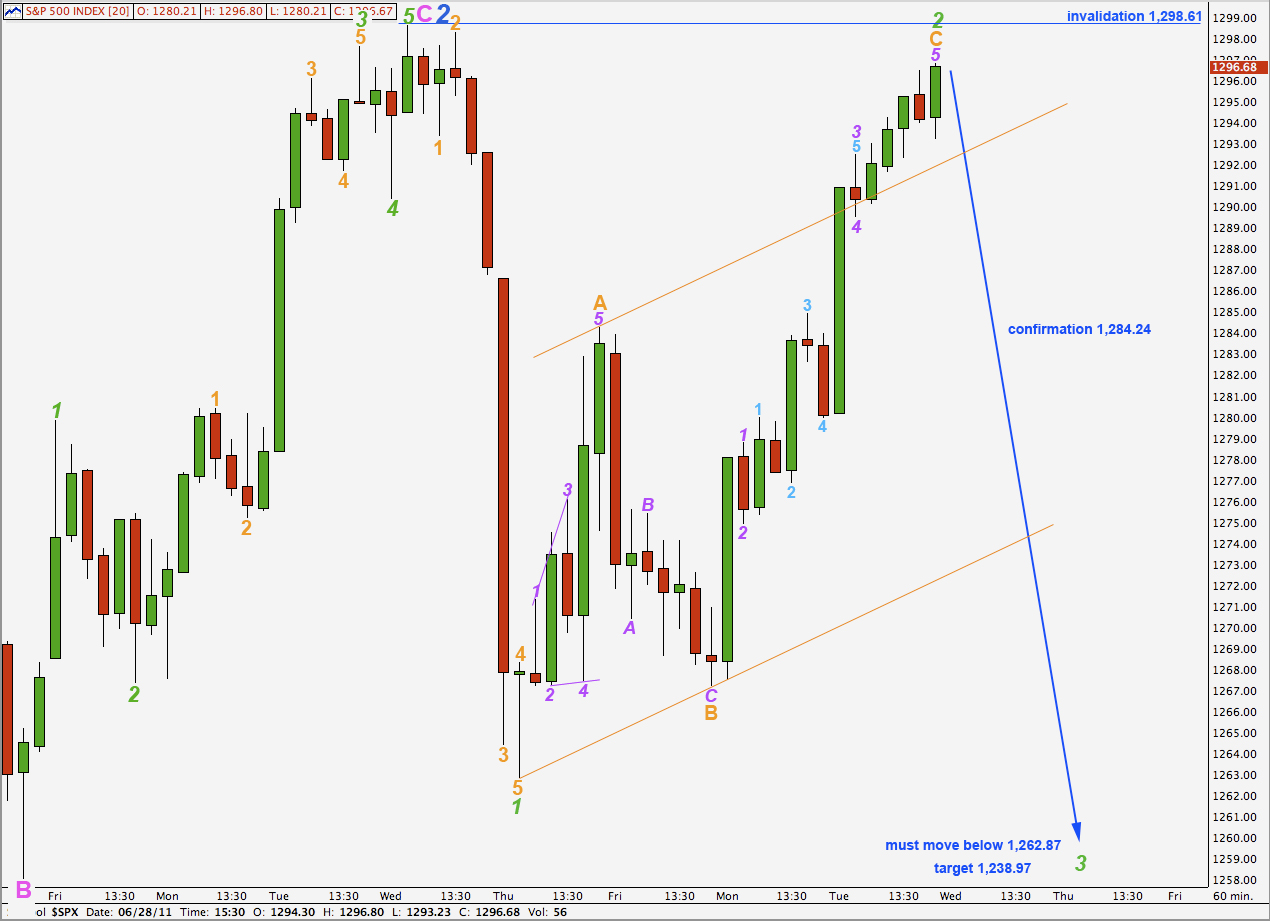
Wave 2 green is a complete zigzag, and wave C orange within it is now a complete impulse.
Wave C orange is 3.07 points longer than 1.618 the length of wave A orange.
Ratios within wave C orange are: wave 3 purple is 1.18 points short of 1.618 the length of wave 1 purple, and wave 5 purple is just 0.13 points longer than 0.618 the length of wave 1 purple.
Ratios within wave 3 purple of wave C orange are: wave 3 aqua is just 0.13 points short of 1.618 the length of wave 1 aqua, and wave 5 aqua is just 0.46 points short of 1.618 the length of wave 3 aqua.
Because these ratios are so good it increases the probability that upwards movement is complete, if this wave count is correct.
Wave C orange has overshot the parallel channel which contains the wave 2 green zigzag. This is typical behaviour for C waves.
When we can see a full hourly candlestick below this channel on the hourly chart then we shall have trend channel confirmation that wave 2 green is over and wave 3 green downwards should have begun.
Because wave 2 is such a deep correction of wave 1 green we may expect wave 3 green to likely be 1.618 the length of wave 1. This would be achieved at 1,238.97.
If we see further upwards movement wave 2 green could move up to touch the start of wave 1 at 1,298.61, but movement above this point would invalidate this wave count.
Alternate Wave Count.
This alternate wave count follows on from yesterday’s hourly alternate.
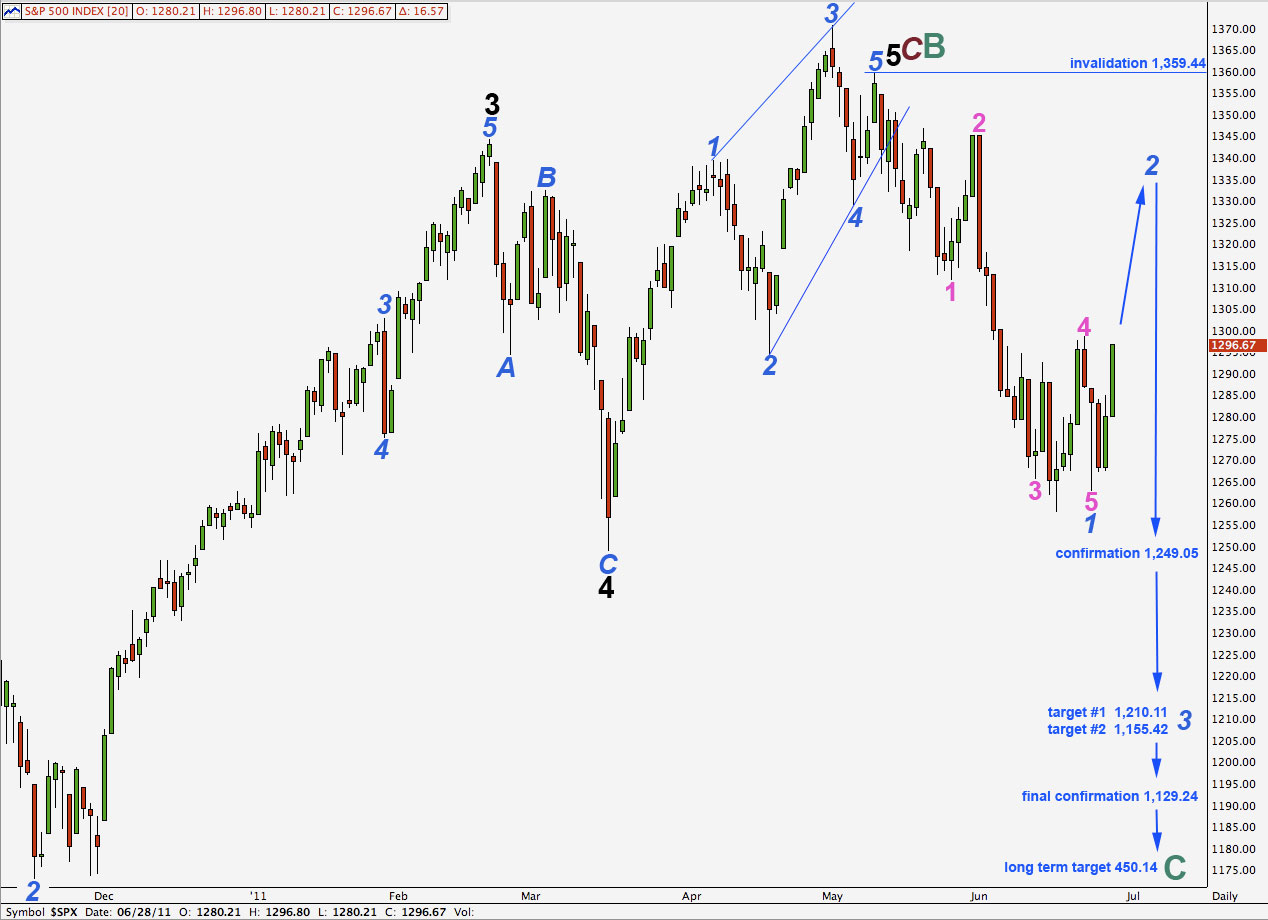
It is possible that we may have seen only an end to wave 1 blue very recently. Technically wave 5 pink would not be truncated as it has moved beyond the end of wave 3 pink, but wave 4 pink has a price extreme below the end of wave 5 pink so a new low in price was not made. This slightly reduces the probability of this wave count.
Ratios within wave 1 blue are: wave 3 pink is just 2.48 points longer than 1.618 the length of wave 1 pink, and there is no adequate fibonacci ratio between wave 5 pink and either of 3 or 1.
The subdivisions of wave 3 pink are not as good a fit as the main wave count. This also reduces the probability of this wave count.
However, this wave count is a valid technical possibility.
Wave 2 blue may not move beyond the start of wave 1 blue. This wave count is invalidated with movement above 1,359.44.
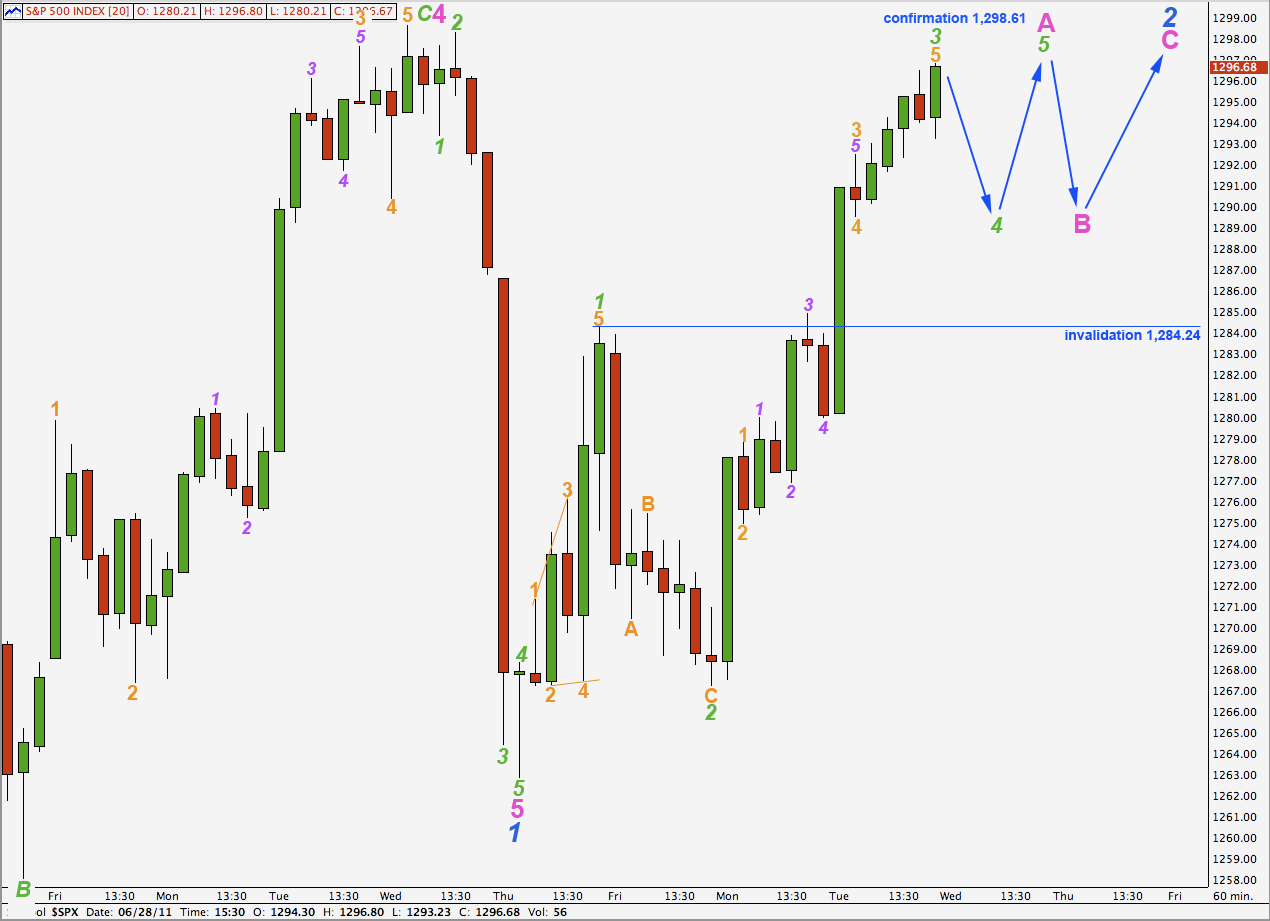
If price moves above 1,298.61 we may consider this wave count confirmed.
Wave 4 green may not move into wave 1 green price territory. This wave count is invalidated with movement below 1,284.24.
We would expect wave 4 green to end about the fourth wave of one lesser degree at 1,289.53.
When we know where wave 4 green ends we may calculate a target for wave 5 green to follow upwards. At this stage expect wave 5 green to be about equal in length with wave 1 green at 16.37 points.
Lara,
Isn’t this steady march higher over the past 3 days more consistent with the first wave of a Minor 5, rather than a corrective wave 2 of Minor 1 down?
It just seems that if we were really in the early stages of P3 down, that corrective waves would be shorter and the impulses down would be stronger.
Peter
I agree Peter. I will publish the most likely alternate today and every day hereafter for this reason.
To fit with other indicies which have made new highs I would see the larger picture as cycle wave B up still, and not primary 2 up within cycle C (Prechters count).
So now we have to take the alternate I reviewed in the end of week analysis much more seriously. It is possible that cycle wave B is incomplete and we are in the final fifth wave upwards of it. The point of differentiation is 1,359.44.
Lara, based on the movement today so far, would we assume then we are still in green 3 up or are we still in 5 green up?
I have it as just ended a third wave on the hourly chart. The fourth wave is probably over as it has a count of 11 on the 5 minute chart, which is corrective, so it could be a complete zigzag.