
Elliott Wave chart analysis for the S&P 500 for 27th June, 2011. Please click on the charts below to enlarge.
Movement above 1,284.24 to 1,284.91 invalidated both of our hourly wave counts. This has necessitated a reanalysis of more recent movement. We still have two hourly wave counts but they both expect exactly the same movement next. Their targets and invalidation points are the same.
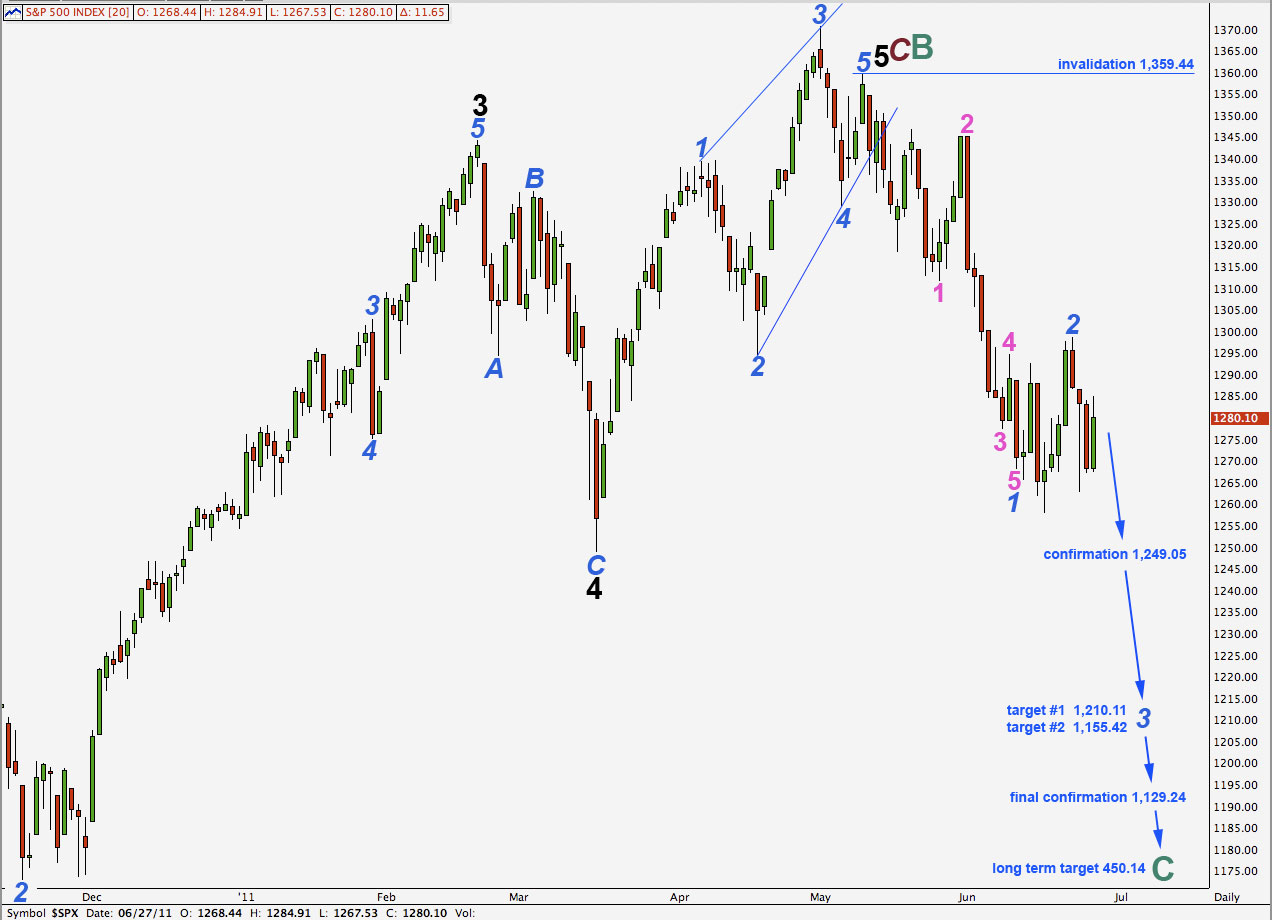
Our mid term target is 1,210.11 where wave 3 blue will reach equality in length with wave 1 blue. At 1,155.42 wave 3 blue would reach 1.618 the length of wave 1 blue. This would be a more likely target. This target is at least two weeks away.
Movement below 1,129.24 will provide strong confirmation that the S&P 500 is in a bear market which should last at least a year, if not several. At that stage the alternate daily chart presented at the end of this analysis will be invalidated.
The long term target at 450.14 is where cycle wave C will reach equality with cycle wave A within a super cycle zigzag. This target is probably over a year away.
Main Wave Count.
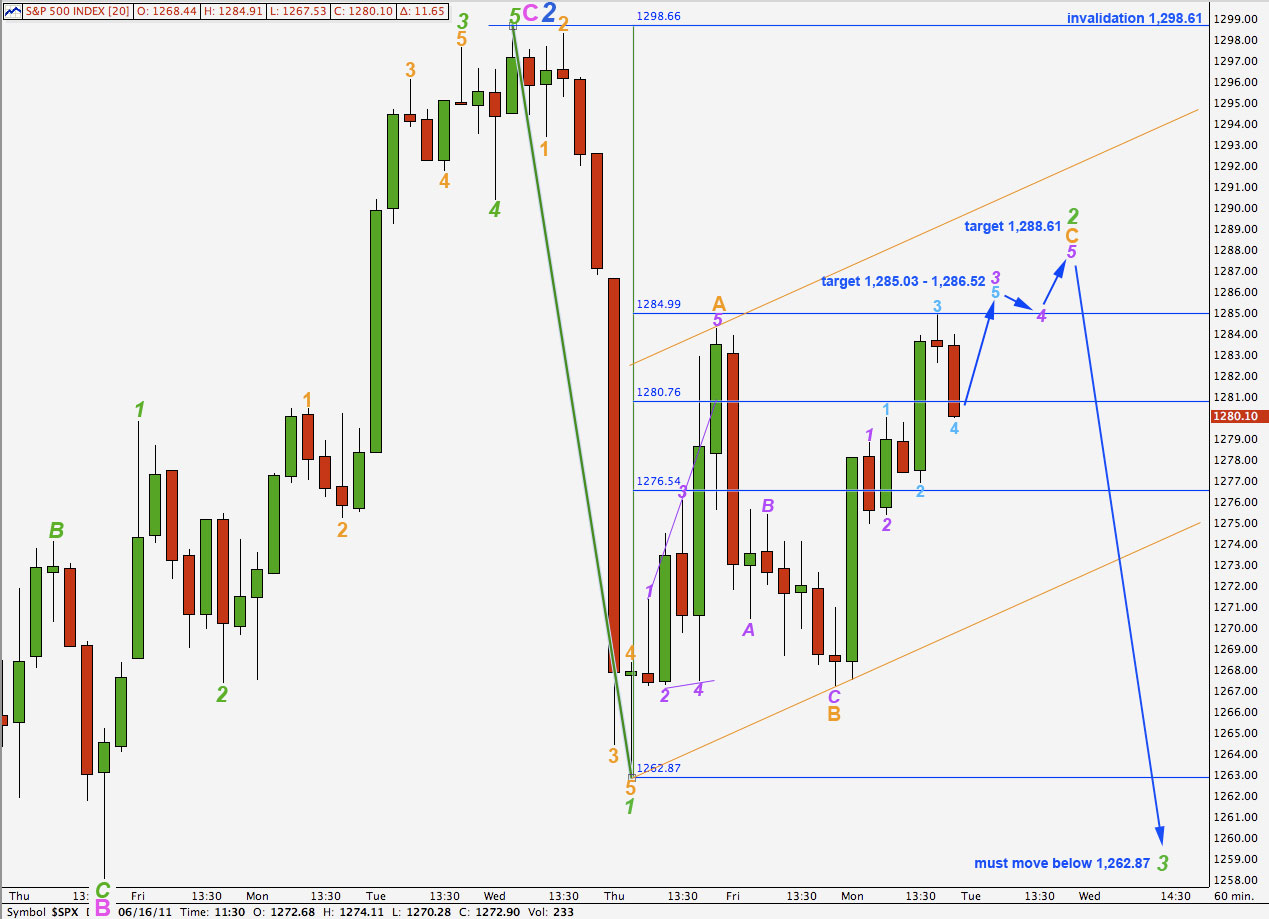
A more careful look at downwards movement labeled wave 1 green on a 5 minute chart shows it is easily seen as a five wave impulse.
Ratios within wave 1 green are: wave 3 orange is 1.88 points short of 6.854 the length of wave 1 orange and wave 5 orange is just 0.26 points longer than equality with wave 1 orange.
Within wave 2 green wave C orange will reach equality with wave A orange at 1,288.61. This is our target for this upwards movement to end.
Within wave 3 purple of wave C orange wave 3 aqua is just 0.14 points short of 1.618 the length of wave 1 aqua. Wave 5 aqua will reach equality with wave 1 aqua at 1,285.03.
At 1,286.52 wave 3 purple will reach equality with wave 1 purple.
We should expect upwards movement to open tomorrow’s session and temporarily end about 1,285.03 to 1,286.52. About this point we should see a small fourth wave correction.
A final fifth wave upwards should end about 1,288.61.
Thereafter, we should see strong downwards movement for a third wave within a third wave.
When markets open tomorrow, if we see movement downwards into wave 1 aqua price territory below 1,279.99, then we would relabel 3 and 4 aqua to 1 and 2 red within wave 3 aqua and expect that wave 2 green may end above 1,288.61.
Wave C orange to end wave 2 green may end about the upper orange trend line.
When we can see movement on the hourly chart below this parallel channel then we shall have confirmation that wave 2 green is complete and the third wave has begun.
When we know where wave 2 green has ended we may calculate a target for wave 3 green downwards. This may be possible with tomorrow’s analysis. In the meantime, if it comes upon us suddenly, we may expect green wave 3 to be about 57.83 points in length if it is 1.618 the length of green wave 1. The deeper wave 2 green is the more likely wave 3 green will be this length.
Wave 2 green may not move beyond the start of wave 1 green. This wave count is invalidated with movement above 1,298.61.
Alternate Wave Count.
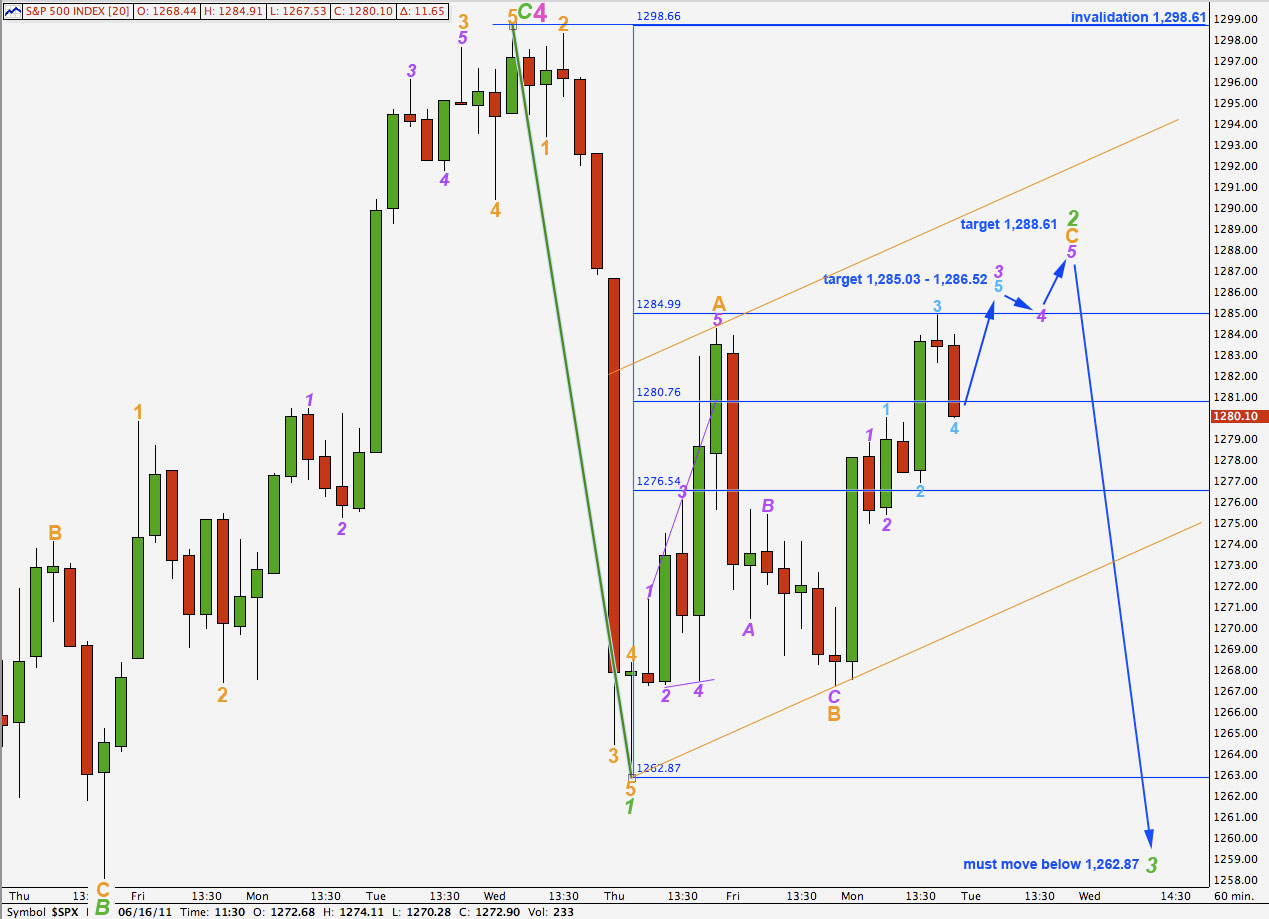
This wave count expects exactly the same movement next.
This wave count sees wave 1 blue as incomplete. When we are near the end of this next five wave structure downwards, with an end to green 3, 4 and 5, then this wave count will diverge from our main wave count. Until that time it expects the same movement.
looking pretty scary….. very close to your invalidation. What is the alternative if we go past 1298.
Yes, scary! However, I can see a complete count of 9 for this C wave. It should be over here.
If it moves above 1,298 at this stage the only alternate I have is our daily alternate I covered in the end of week analysis. But that does not mean that is the only possibility. I’ll be looking for another alternate when I do todays analysis.