
Elliott Wave chart analysis for the S&P 500 for 23rd june, 2011. Please click on the charts below to enlarge.
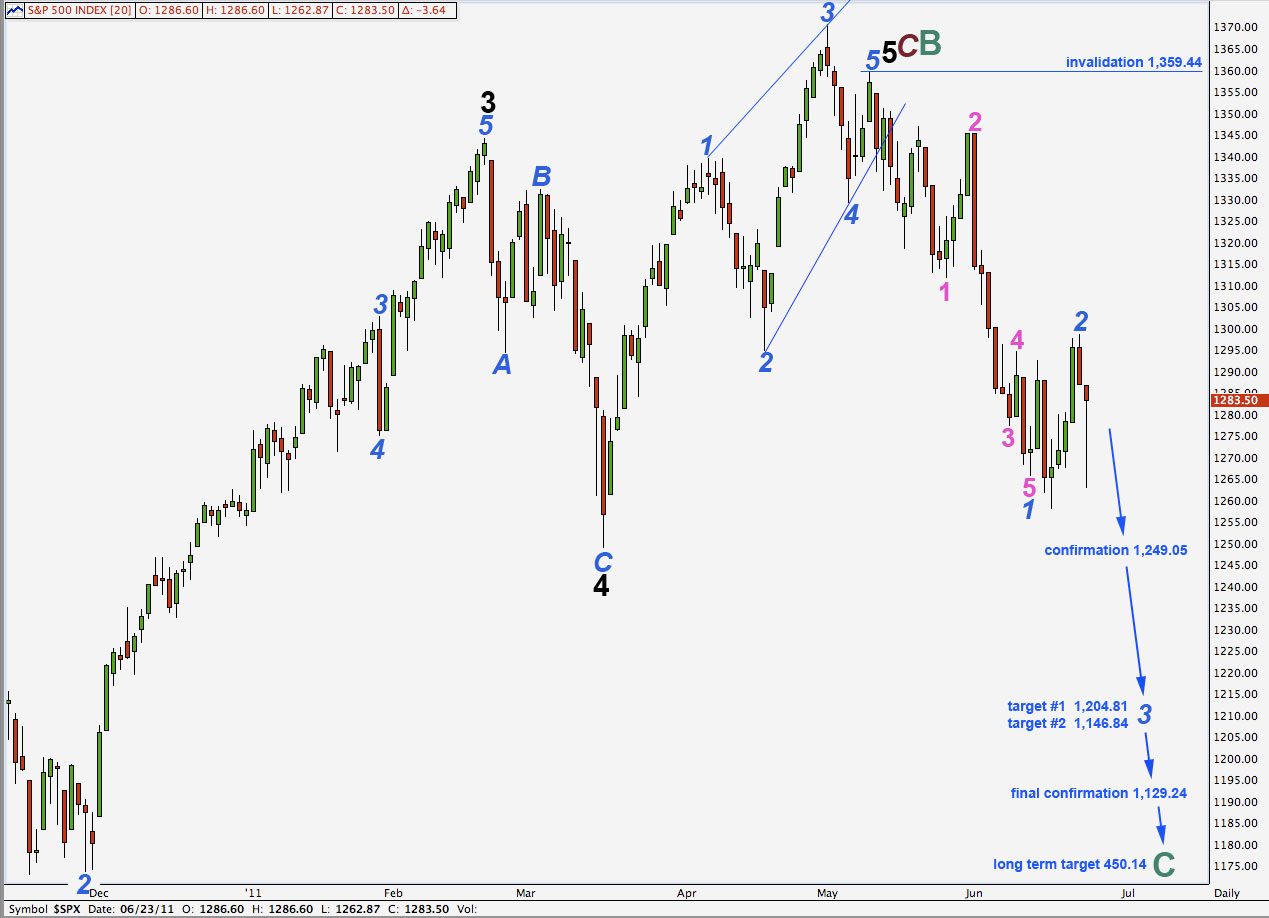
Downwards movement invalidated the hourly wave count and indicated that the next third wave down had begun earlier than we were expecting.
Wave 3 blue must move beyond the end of wave 1 blue which for this wave count is at 1,265.64. If labeling of waves 1 and 2 blue is correct here then this core rule is met already.
We should expect this third wave down to be strong and volatile.
At 1,204.81 wave 3 blue will reach equality in length with wave 1 blue. At 1,146.84 wave 3 blue would reach 1.618 the length of wave 1 blue. This would be a more likely target.
We may need to move the degree of labeling for downwards movement up one degree, I will keep this in mind over the next couple of weeks.
If this wave count is correct then we should see confirmation with price movement below 1,249.05 very soon.
Movement below 1,129.24 will provide strong confirmation that the S&P 500 is in a bear market which should last at least a year, if not several. At that stage we may be confident it should move to new lows below 666.79. A truncated cycle degree C wave would be highly unlikely.
The long term target at 450.14 is where cycle wave C will reach equality with cycle wave A within a super cycle zigzag. This target is probably over a year away.
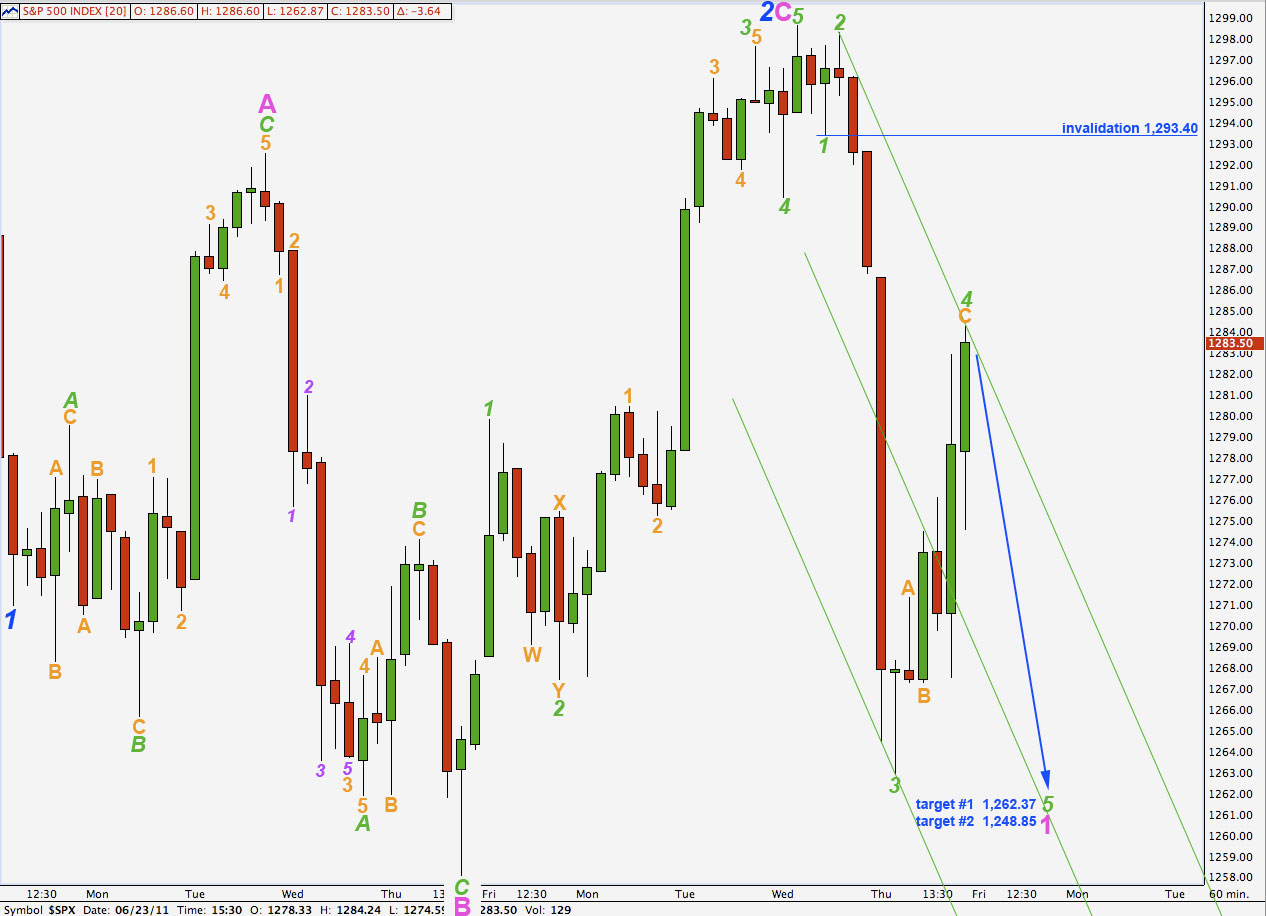
Downwards movement was unexpected, invalidating the hourly wave count.
Wave 2 blue must have been over at 1,298.61. Wave C pink has no fibonacci ratio to wave A pink.
Ratios within wave C pink of wave 2 blue are: wave 3 green has no fibonacci ratio to wave 1 green and wave 5 green is just 0.09 points short of 0.382 the length of wave 1 green.
Ratios within wave 3 green of wave C pink are: wave 3 orange is 0.22 points short of 1.618 the length of wave 1 orange and wave 5 orange is 0.91 points longer than 0.382 the length of wave 1 orange.
I have taken another look at the subdivisions within wave 1 orange of wave 3 green of wave C pink. On a 15 minute chart, if it ended with a slight truncation, this piece may be labeled as a complete impulse. The prior wave count saw the end slightly higher and it was labeled as 1-2 orange, 1 purple. With the labeling here it is possible to see a complete impulse for wave C pink.
Within wave 1 pink of wave 3 blue downwards wave 3 green is just 0.32 points short of 6.854 the length of wave 1 green, and it is a complete 5 wave impulse on the 15 minute chart.
Within wave 4 green wave A orange is a complete impulse and wave C orange may be a complete, or almost complete, ending diagonal. Wave C orange has no fibonacci ratio to wave A orange, but it is almost exactly twice the length of wave A. If it was not over at 1,284.24 then it is likely to be over very soon.
If wave 5 green begins at 1,284.24 then it would reach 0.618 the length of wave 3 green at 1,262.37. At 1,248.85 wave 5 green would reach equality with wave 3 green. These are our two targets for tomorrow.
We may use Elliott’s technique to draw a channel about this downwards movement. If wave 4 green moves higher we must redraw the channel. Wave 5 green may end either midway on the channel (more likely) or at the lower end of the channel (less likely).
Any further movement upward when markets open tomorrow should not move above 1,293.40 as wave 4 green may not move into wave 1 green price territory.
If this wave count is invalidated with upwards movement then wave 2 blue would be continuing sideways and higher as a double flat or double combination correction.
Alternate Wave Count.
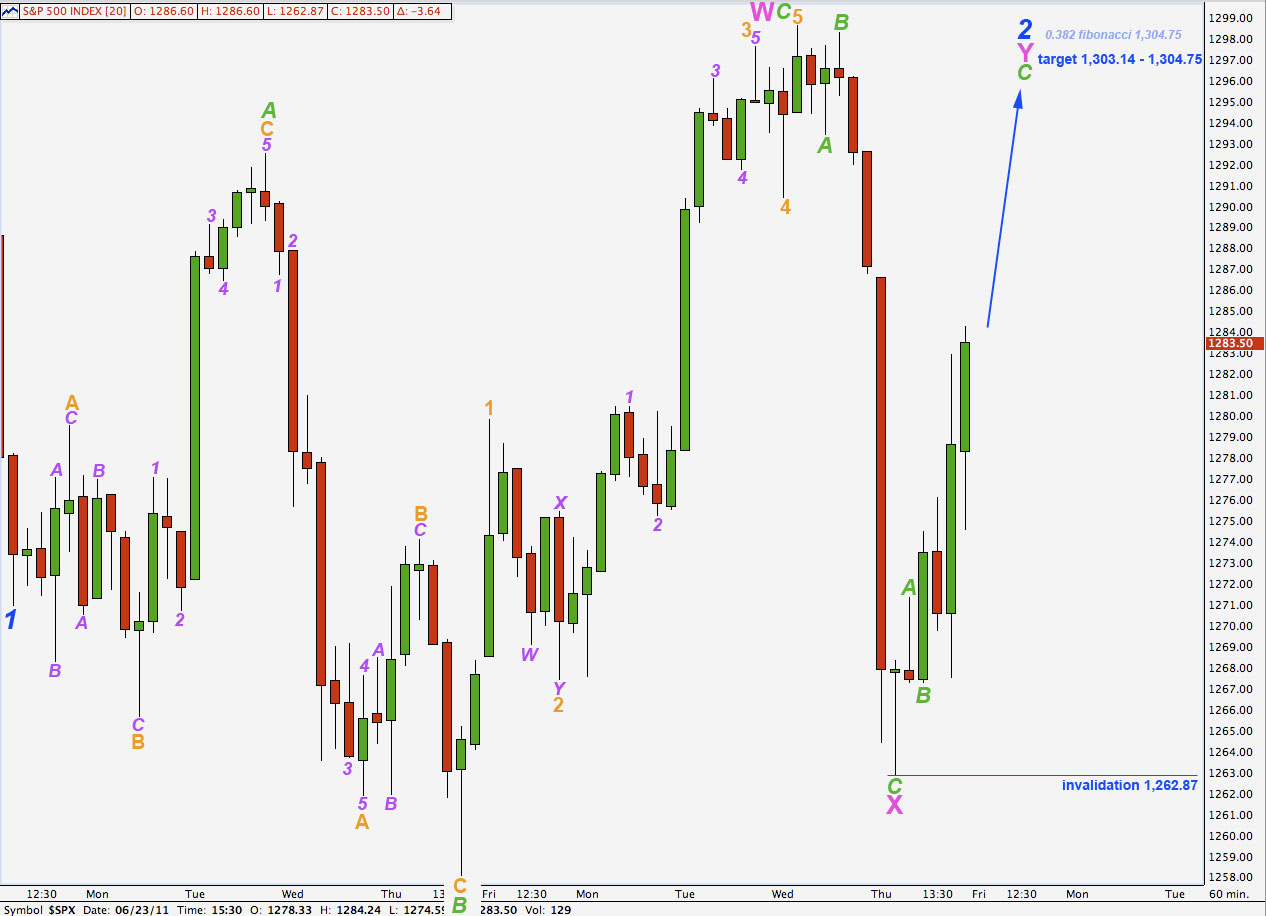
It is possible that wave 2 blue is not over and could continue further sideways and higher as a double combination: flat – X – zigzag.
If price moves above 1,293.40 then Thursday’s downwards movement will be a clear zigzag. This would confirm this wave count and we should expect further upwards movement towards the target 1,303.14 where wave C green would reach 4.236 the length of wave A green. This is close to the 0.382 fibonacci ratio of wave 1 blue at 1,304.75.
The probability of this alternate wave count is lower than the main wave count because single structures are more common than combinations.
Cycle studies- not conneted to Elliott waves- confirm a decline in the markets next year- by June.
This year, we can see a debt default causing a stock market decline and the Fed’s QE3 and Congress compromising a debt raise good until….next June.
Keep kicking that can!
welcome back to americans markets and thank you.
Do you mean with 1 blue is the first wave from primary 3 from primary C ?
Hy Lara:
Sorry you didn’t put out a video covering the next session. As well written as your reports are, the subject matter makes me dizzy when I read them. Regards, Mike
Michael, sorry, the video post was published about a minute or so before it was fully uploaded. A slight communication problem on my end.
Best read sitting down then 🙂