
Elliott Wave chart analysis for the S&P 500 for 14th June, 2011. Please click on the charts below to enlarge.

As expected, we saw upwards movement for Tuesday’s session to end 4.4 points above our second target for the main hourly wave count.
I have three hourly wave counts for you today presented in order of probability.
Ratios within wave 1 blue are: wave 3 pink has no fibonacci ratio to wave 1 pink and wave 5 pink is 2.29 points short of 0.382 the length of wave 3 pink (this ratio was calculated incorrectly yesterday as 0.36 short).
In the long term it is likely that cycle wave C will reach equality with cycle wave A at 450.14. Cycle wave C should take at least a year, if not longer, to complete.
Wave 2 blue may not move beyond the start of wave 1 blue. This wave count is invalidated with movement above 1,359.44.
First Hourly Wave Count.
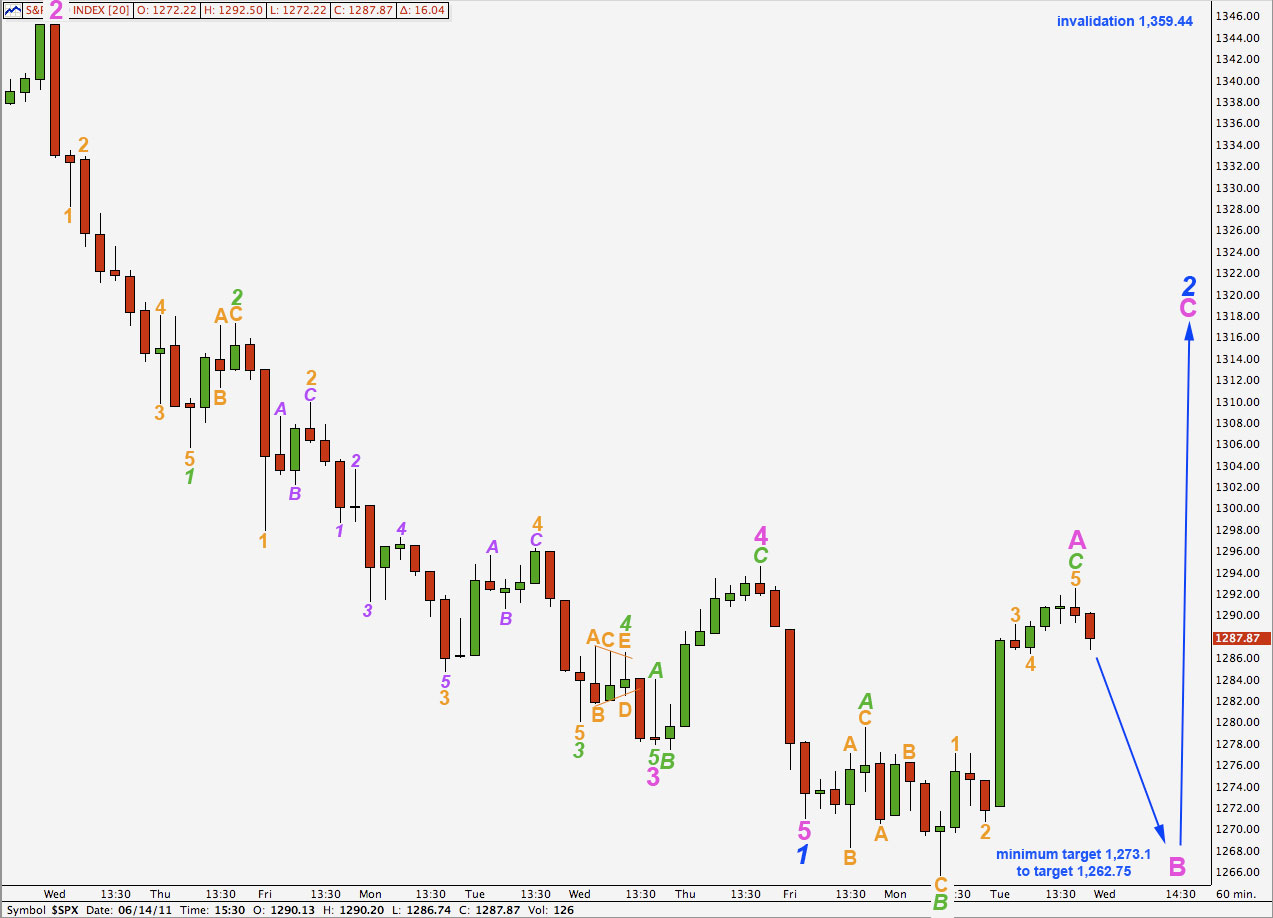
Wave 2 blue may be incomplete and unfolding as a flat correction.
Within wave A pink expanded flat there is no fibonacci ratio between waves A and C green.
Ratios within wave C green are: wave 3 orange is just 0.06 points short of 1.618 the length of wave 1 orange and wave 5 orange has no fibonacci ratio to either of 1 or 3.
Wave B within a flat must reach at least 90% the length of wave A. Wave B pink must reach to 1,273.1 minimum.
The most common length of wave B in relation to A within a flat is between 100% and 138%. Wave B pink will reach 138% the length of wave A at 1,262.75.
Wave B pink must subdivide into a three wave structure (or possibly, but very unlikely, a triangle). If it is a flat correction its B wave may make a new high above 1,292.5 and so there is no short term invalidation point for this wave count.
When wave B pink has completed a three and reached down to 1,273.1 minimum then this wave count expects another upwards wave for wave C pink.
Wave C pink must subdivide as a five and is very likely to move beyond the end of wave A pink above 1,292.5.
If the downwards movement we are expecting for tomorrow is very strong and looks more like a five than a three then the second wave count below may be correct.
Second Hourly Wave Count.
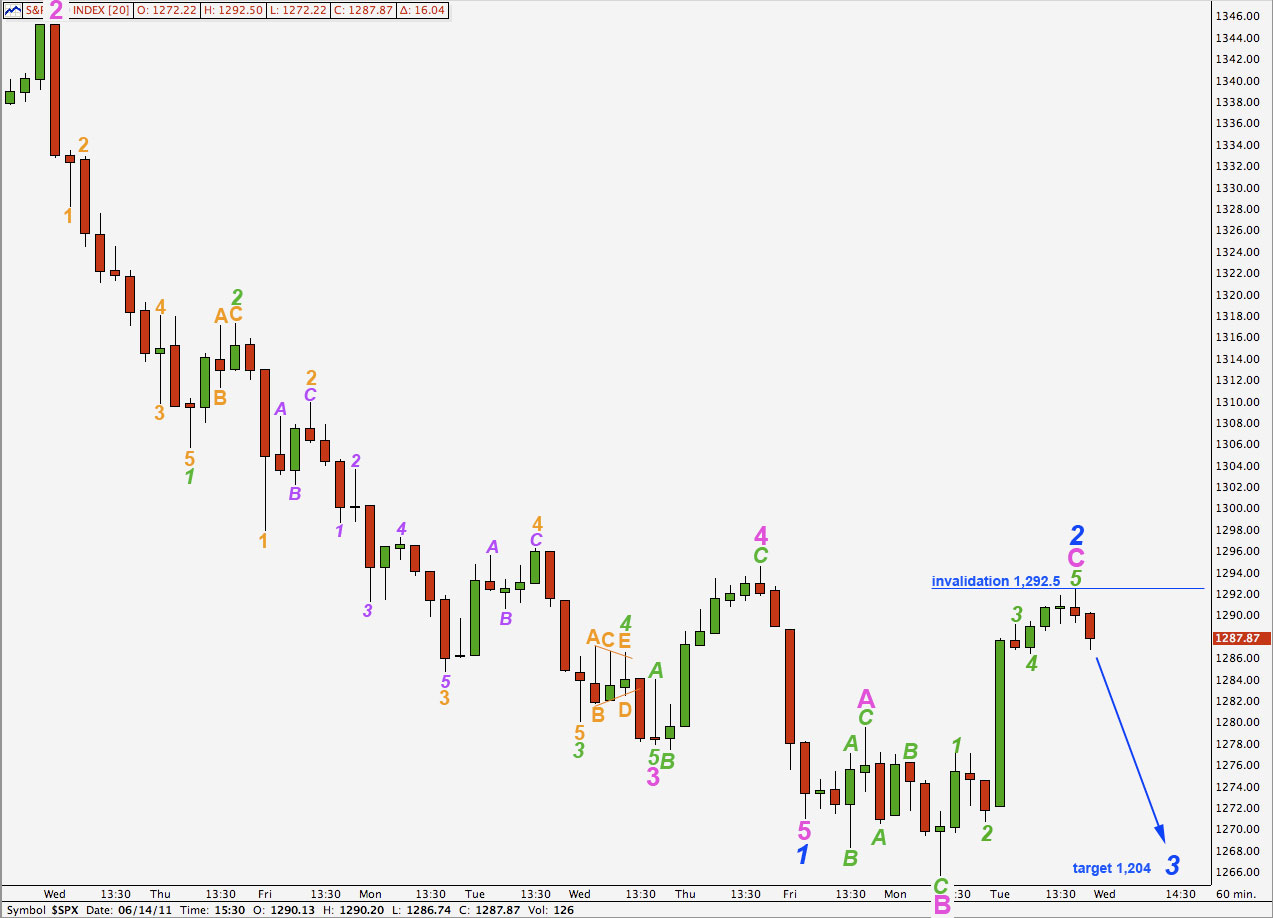
If we simply move the degree of labeling for this recent correction up one degree we may have an end already to wave 2 blue.
There is a lot of downwards pressure currently on the S&P 500, as exhibited by a strong truncation to end wave 5 black, a running flat within wave 1 pink of wave 1 blue, and some very strong downwards days. It is possible then that corrections may be brief and shallow and so an early completion for wave 2 blue is something we must consider.
If downwards movement tomorrow is very strong indeed and does not look like it is unfolding as a three then this wave count may be correct.
A first conservative target for wave 3 blue is at 1,204 where it would reach equality with wave 1 blue.
Movement above 1,292.5 would invalidate this wave count.
This wave count is entirely possible, but I consider it less likely than the first wave count as this one sees wave 2 blue out of proportion to wave 1 blue and a very shallow 24% correction.
Third Hourly Wave Count.

While price remains below 1,294.54 this hourly wave count will remain valid.
Wave 2 green within wave 5 pink is now well out of proportion to all other waves at green degree here. This reduces the probability for this wave count.
This wave count must see price move beyond the end of wave 1 green below 1,270.94 as wave 3 must move beyond 1.
Thanks Lara.
By the way, I love your fern picture on the top of the page!
John A
Hi John, sorry for the late reply, I meant to let you know that the fern is one of our national symbols here in New Zealand. It is our silver tree fern, Cyathea dealbata. It shows nice fractal patterns.