
Elliott Wave chart analysis for the S&P 500 for 31st May, 2011. Please click on the charts below to enlarge.
I am reducing the number of charts we are working with today to 2. We shall use only the most likely bullish wave count (#1) alongside the most likely bearish wave count (#2). The remaining charts still remain valid and we may still use the invalidation guide at the end of this analysis to indicate which wave counts are invalidated and when.
Wave Count #1.

Upwards movement was what we were expecting was most likely for this, our primary wave count, and that is what we have seen.
Price is now firmly back in the parallel channel containing primary wave C upwards.
Cycle wave A subdivides most easily into a three wave zigzag. At super cycle degree this wave count sees the S&P as within a flat correction. Wave B of a flat must retrace at least 90% of wave A and so cycle wave B will reach 90% the length of cycle wave A at 1,494.16.
At 1,553.42 wave 5 black will reach equality with wave 3 black. At 1,563.92 primary wave C will reach equality with primary wave A. This is our small target zone for upwards movement to end.
Within black wave 5 we may be seeing an extended third wave. This fits with the high target zone; an extension within one of the actionary waves of wave 5 black would be required to reach the target and the most commonly extended wave is the third.
I have moved the lower invalidation point up. Now that wave 3 pink is looking much more likely to be underway we should not expect any second wave correction within it to move beyond the start of its first. This wave count is invalidated with movement below 1,311.8.

We expected it was most likely that we would see upwards movement this week and Tuesday has begun well.
The S&P may be moving into the middle of a third wave tomorrow. A very short term target for the current third wave at purple degree to end is about 1,351.56 where it will reach equality with wave 1 purple.
Within wave 3 orange we shall see one more correction for wave 4 purple. When wave 3 purple is complete the invalidation point may move up to the high of wave 1 purple at 1,344.75. Wave 4 purple may not move into wave 1 purple price territory.
When markets open tomorrow the invalidation point must sit at 1,334.66 as any second wave correction within wave 3 purple may not move beyond its start.
Wave 3 orange may take another two to three days to complete. At 1,365.48 wave 3 orange will reach 1.618 the length of wave 1 orange.
Wave Count #2.

If this wave count (or any bearish wave count) is correct then we would not expect price to move back into the parallel channel containing the last impulse upwards. We would expect the lower end of this channel to provide strong resistance to upwards movement. We would also not expect such a strong upwards day as we saw on Tuesday to begin this new trading week.
Wave behaviour no longer fits this wave count.
If we have a high in place then any movement above 1,359.44, the end of wave B at cycle degree, would invalidate this wave count.

On the hourly chart this wave count expects mostly the same movement next as the main wave count, except this wave count cannot allow movement above 1,359.44. Wave 2 orange may not move beyond the start of wave 1 orange.
Wave C orange must complete a five wave structure. When it is complete, if price remains below 1,359.44, then this wave count will remain valid despite its detractions.
At 1,351.38 wave C orange will reach equality with wave A orange.
For this second wave count upwards movement for wave 3 purple would not be as high as for the main wave count.
To see daily charts for our other alternate wave counts 3 to 7 see last analysis here.
Invalidation Guide
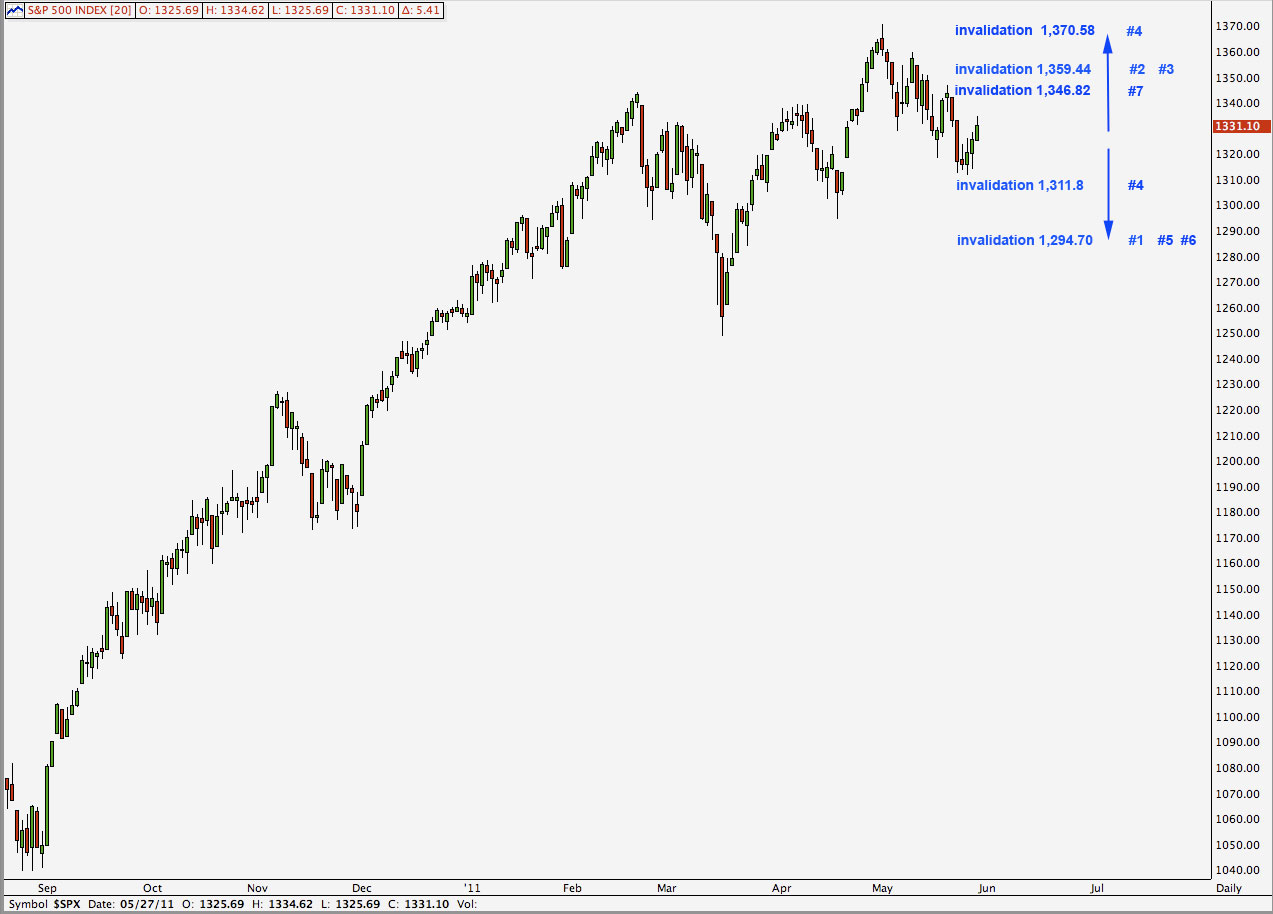
This market action is getting ridiculous. So the two hourly counts for today have been invalidated quickly…so are we back to no-man´s land again?