
Elliott Wave chart analysis for the S&P 500 for 26th May, 2011. Please click on the charts below to enlarge.
I have updated the table with a little bit of new information today.
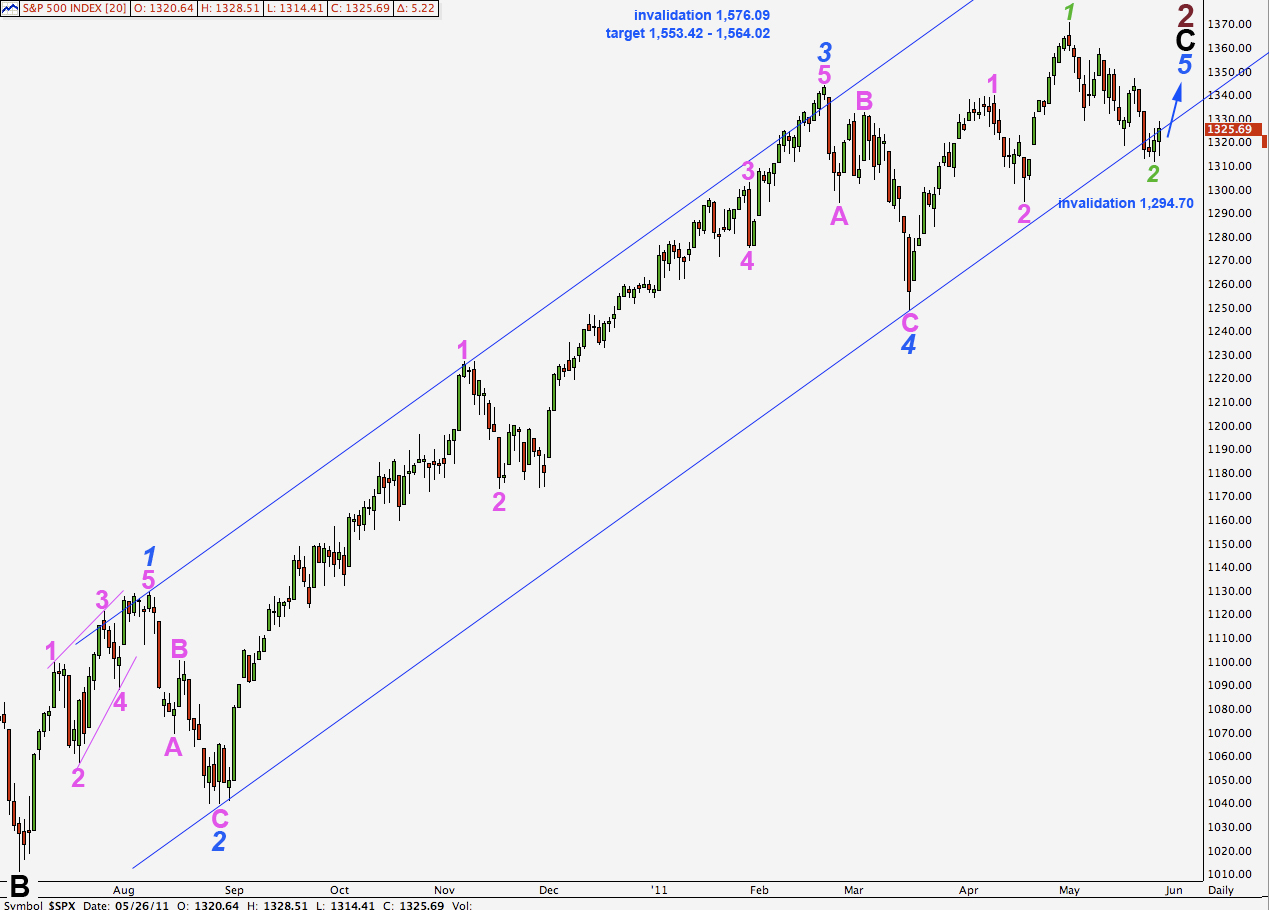
Wave counts 1, 2, 4, 5 and 7 all see the larger historical count as having the start of the correction at the all time high in October 2007 at 1,576.09. In the historic analysis, as it currently is, this wave count is listed as the “alternate”.
Wave counts 3 and 6 are listed at the end of the table and both see the larger historical count as having the start of the correction (and expanded flat) in March, 2000 at 1,552.87. These two counts do not allow for a new all time high and so do not fit with other indices (such as the Russell 2000) which have made new all time highs.
Table
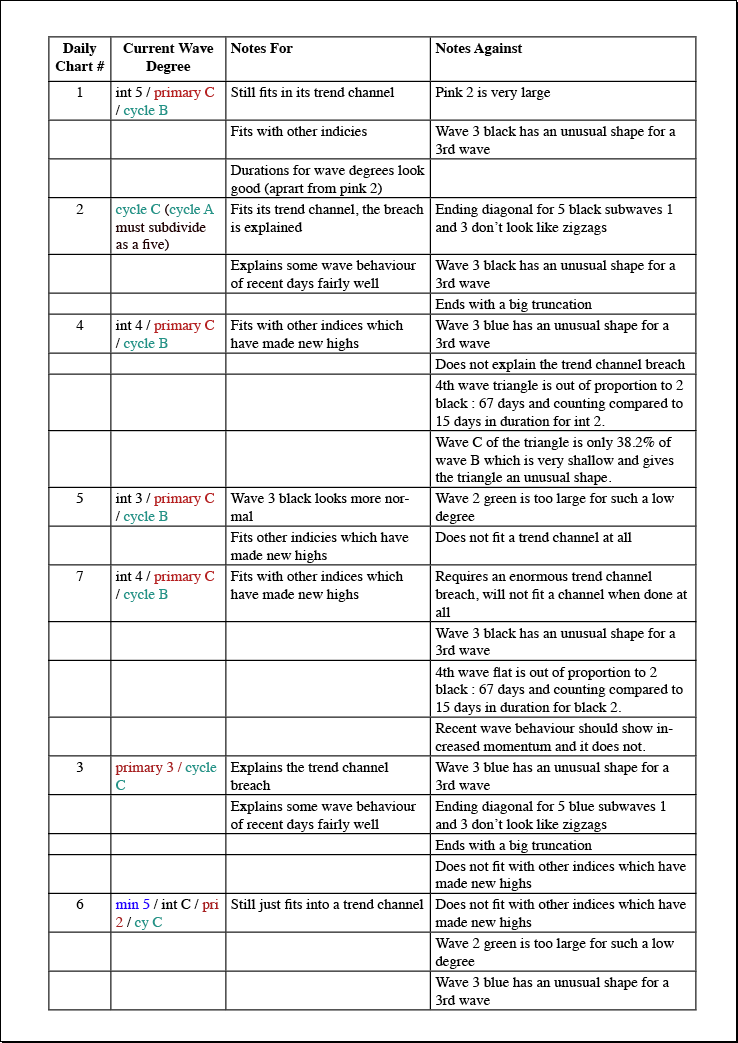
Click here to download a .pdf of the table above.
Daily Chart #1
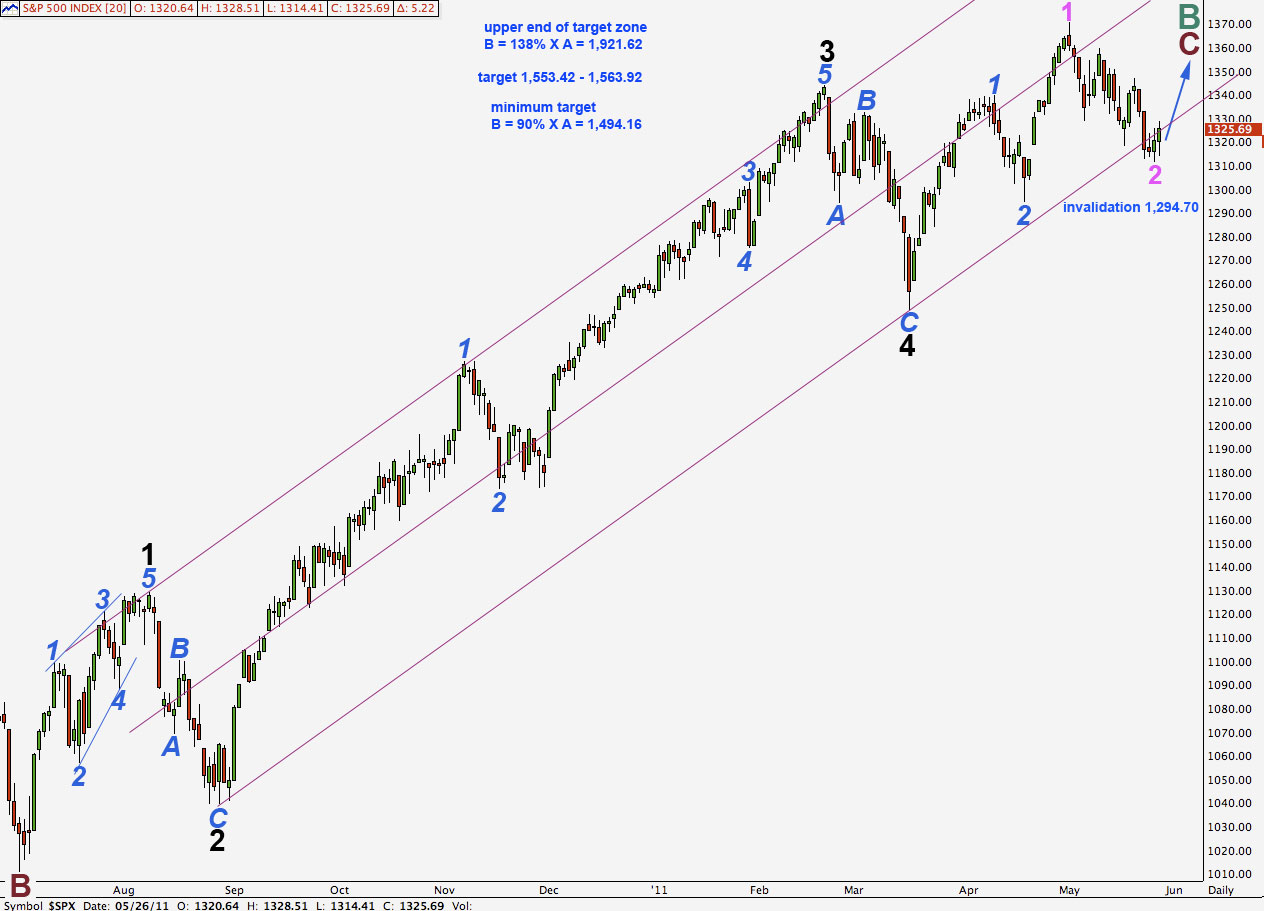
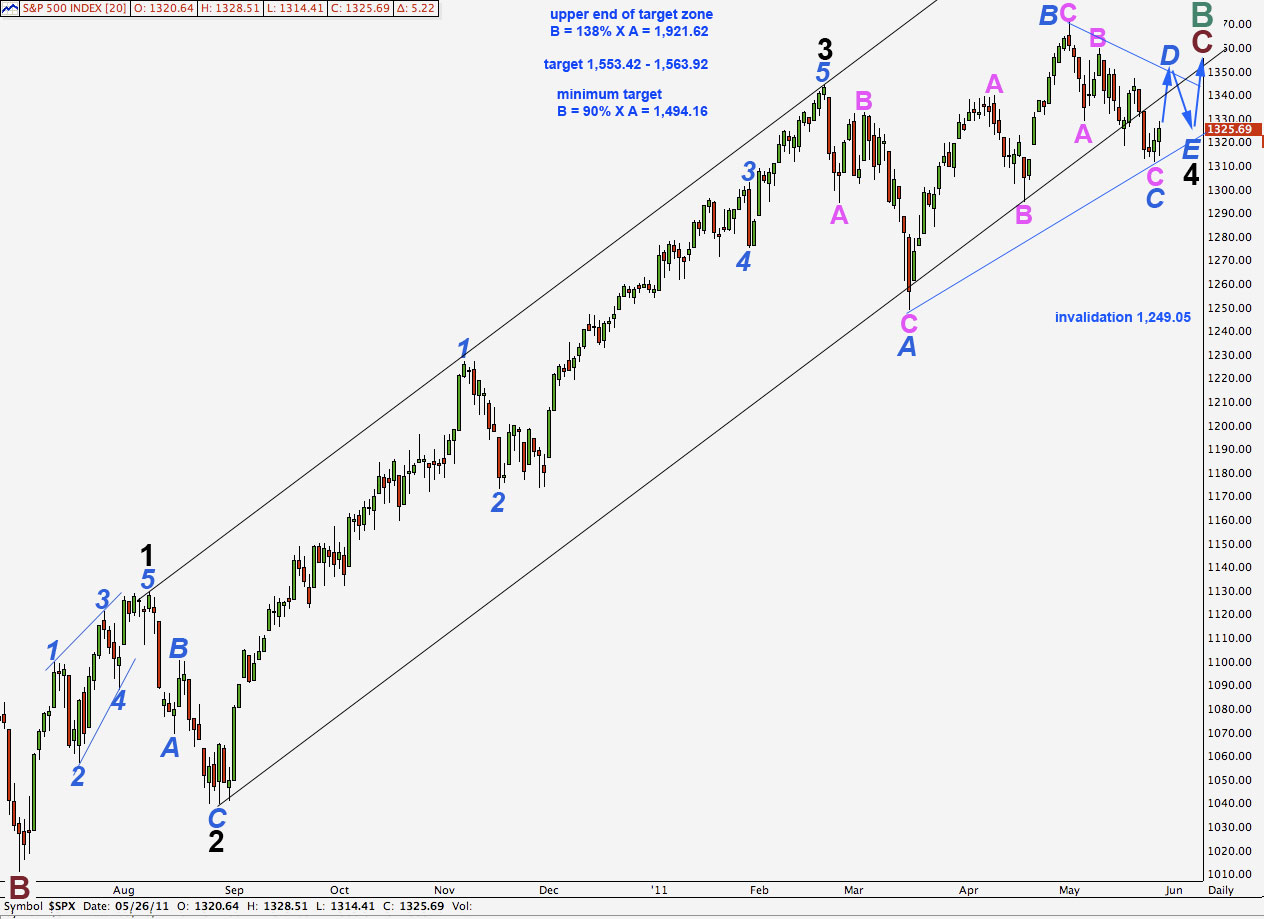
Importantly, the trend channel still does not yet have a full breach, just an overshoot. With price moving back into the channel this wave count is increasing in probability.
We also have a bullish engulfing candlestick pattern at the low of 2 pink suggesting a trend change.
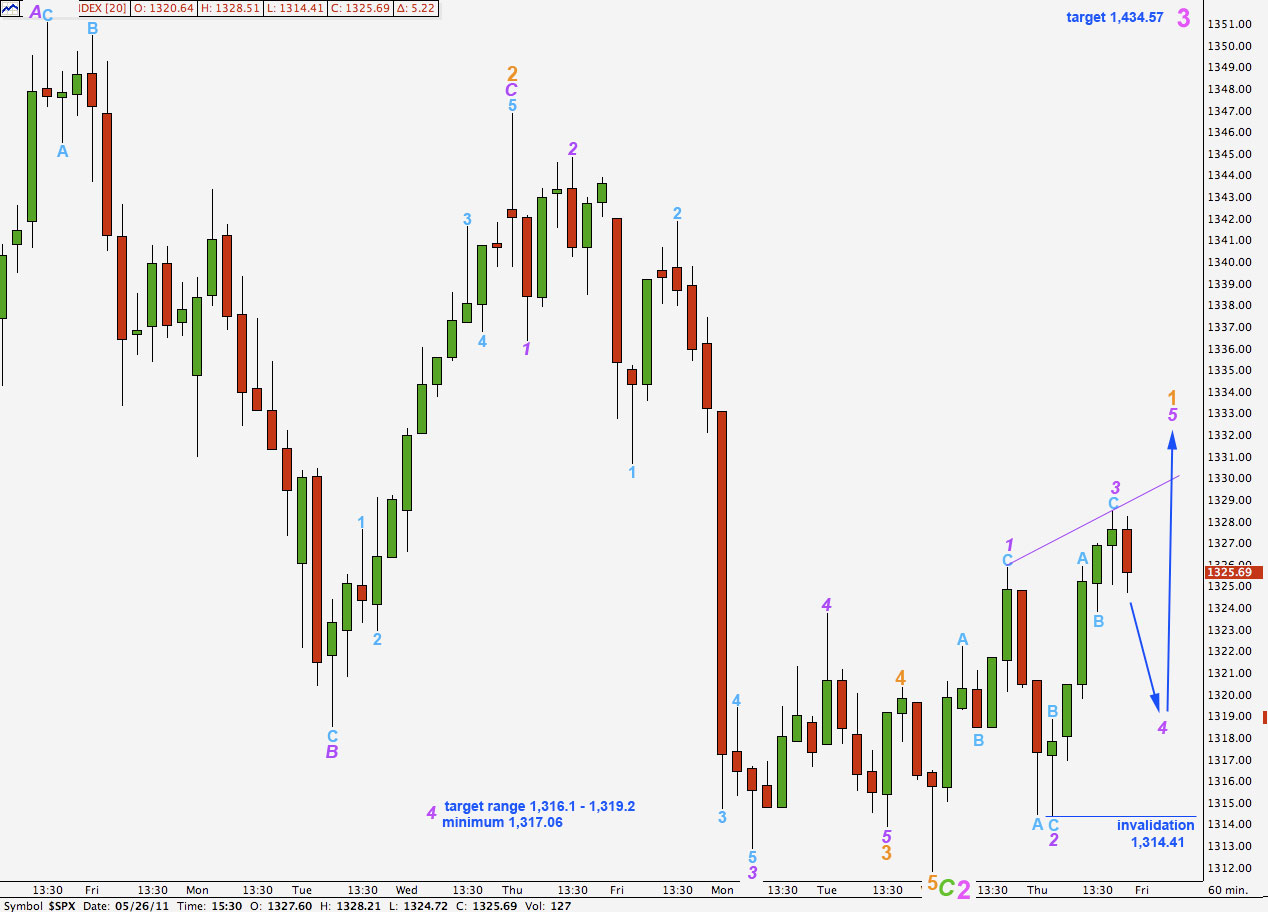
Upwards movement of the last couple of days is in overlapping zigzag movements. The first new wave upwards may be unfolding as an expanding leading diagonal.
Wave 4 purple within the diagonal should unfold as a zigzag. It may reach to 0.66 of wave 3 purple at 1,319.20 to a maximum of 1,317.06 where it would reach equality with wave 2 purple.
Wave 4 of a diagonal should overlap into wave 1 price territory (this one does already) but may not move price beyond the end of wave 2. This diagonal structure is invalidated with movement below 1,314.41.
Thereafter, another zigzag upwards for wave 5 purple should be at least 14.1 points in length if it is to be longer than wave 3 purple.
This would end the leading diagonal for wave 1 orange. Wave 2 orange to follow may not take price to a new low below the start of wave 1 orange. At that stage the invalidation point must move down to 1,311.80.
At 1,434.57 wave 3 pink will reach 1.618 the length of wave 1 pink. This is a mid term target for this wave count which is a couple of weeks or so away.
Daily Chart #2
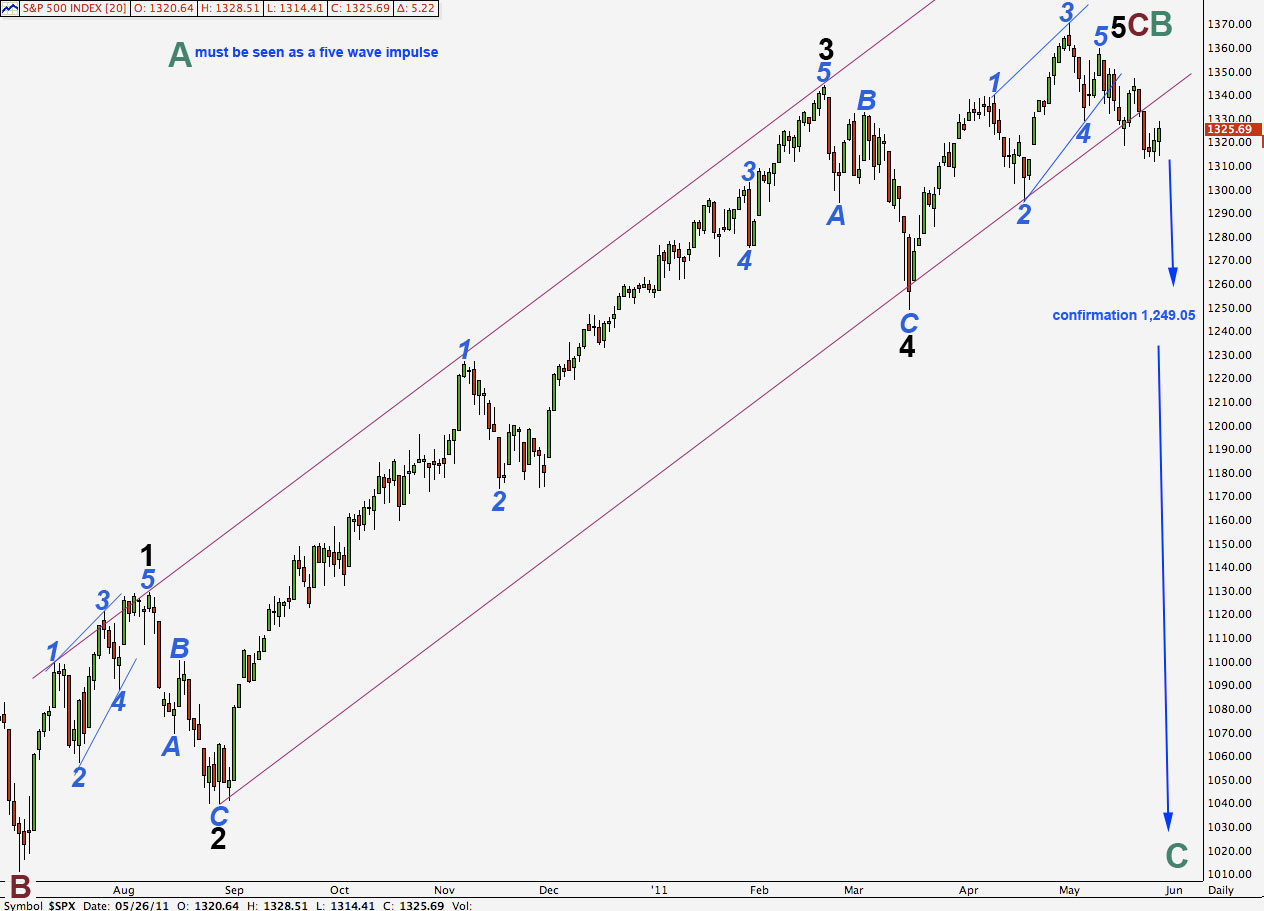
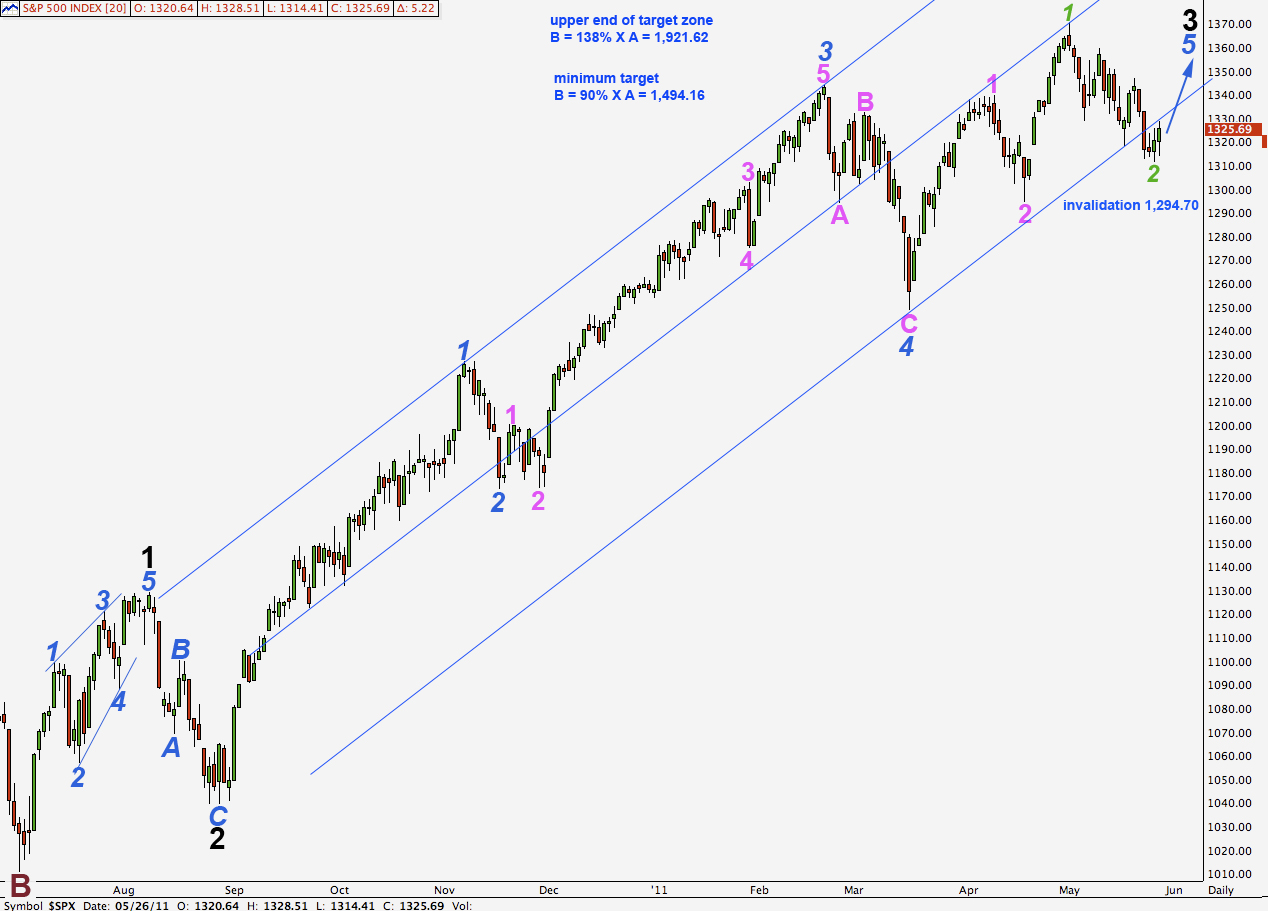
This is the only chart which is following the alternate historic wave count but requires cycle wave A downwards, from 1,576.06 to 666.79, to be viewed as a five wave structure. All other wave counts which follow the alternate historic count see this wave as a three, which it is most easily seen as. This is because cycle B has not reached 90% the length of wave A, which is a requirement for a flat correction where A subdivides into a three.

The short term movements and subdivisions of this hourly wave count are the same as the main hourly wave count.
We would expect here that the leading diagonal is wave A orange of a zigzag for wave 2 green.
Wave 2 green may not move beyond the start of wave 1 green. This wave count is invalidated with movement above 1,359.44.
Daily Chart #4
Daily Chart #5
Daily Chart #7
Daily Chart #3
Daily Chart #6
Given that many of your hourly wave counts have not played out lately and the fact that we have so may possibile alterntives, would you be willing to do a mid-day update during times of high uncertainty.
I’m in New Zealand and the time zone is opposite to New York. When I get up at 6 am here New York is finishing it’s afternoon.
For me to do a mid-day update as you suggest would require getting up in the small hours my time.
Because I have a family to care for and a school age son I have to keep normal hours and have to sleep at this time.