Elliott Wave chart analysis for Gold for 26th May, 2011. Please click on the charts below to enlarge.
To see an historic count for Gold please see last analysis here.
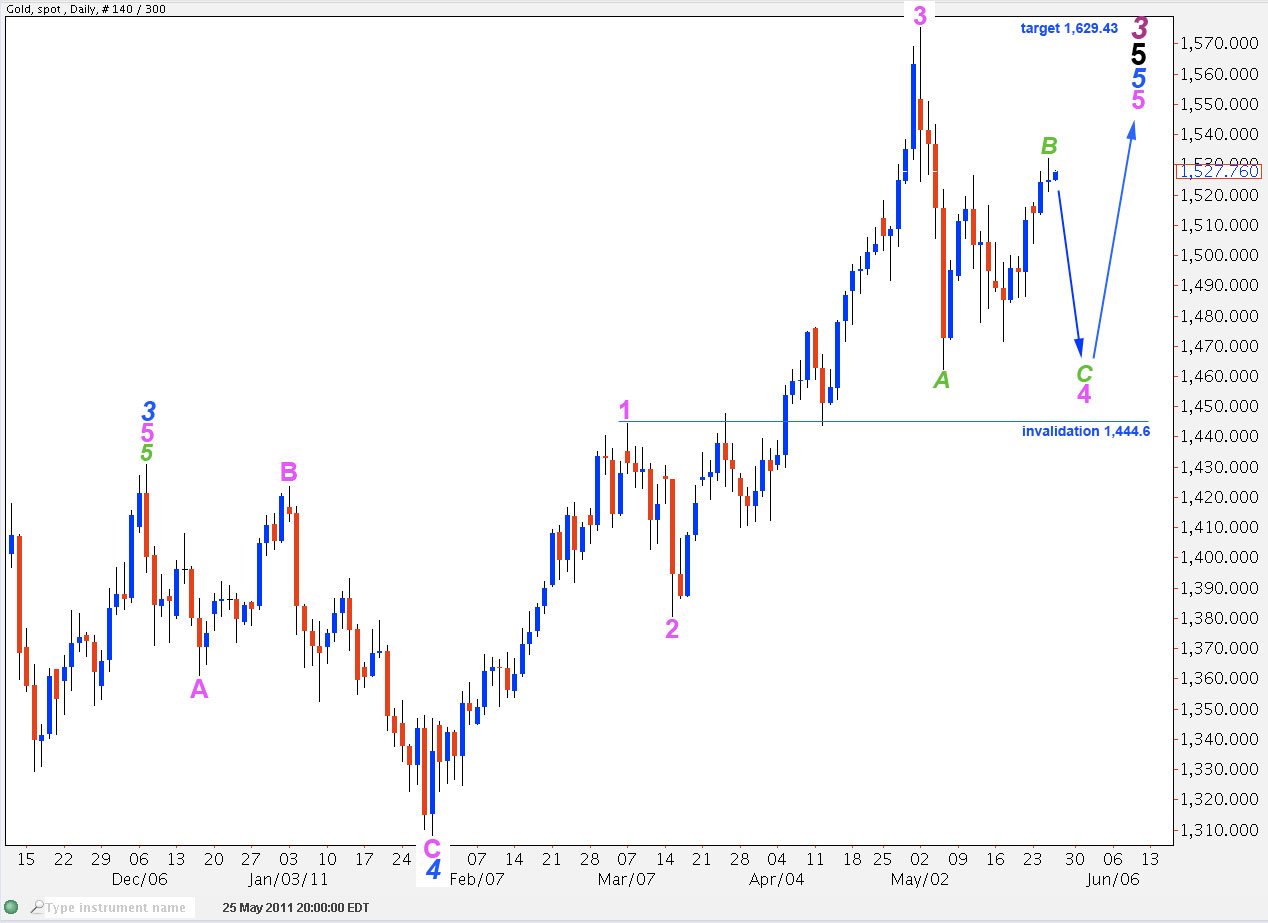
Last analysis of gold expected further upwards movement towards a target of 1,532.09 to 1,535.98. Gold has moved higher and is today within this target zone with a high at 1,532.22.
Within blue wave 5 upwards of black wave 5 to end primary wave 3, this wave count sees gold within a minute (pink) fourth wave correction.
Wave 4 pink is unfolding as a zigzag.
When it is complete then gold will be due to make new highs (most likely) in a final fifth wave upwards to end primary wave 3.
At 1,629.43 intermediate (black) wave 5 will reach 1.618 the length of black wave 3.
For fibonacci ratio analysis up to and including wave 3 purple within wave B green of wave 4 pink please see last analysis here.
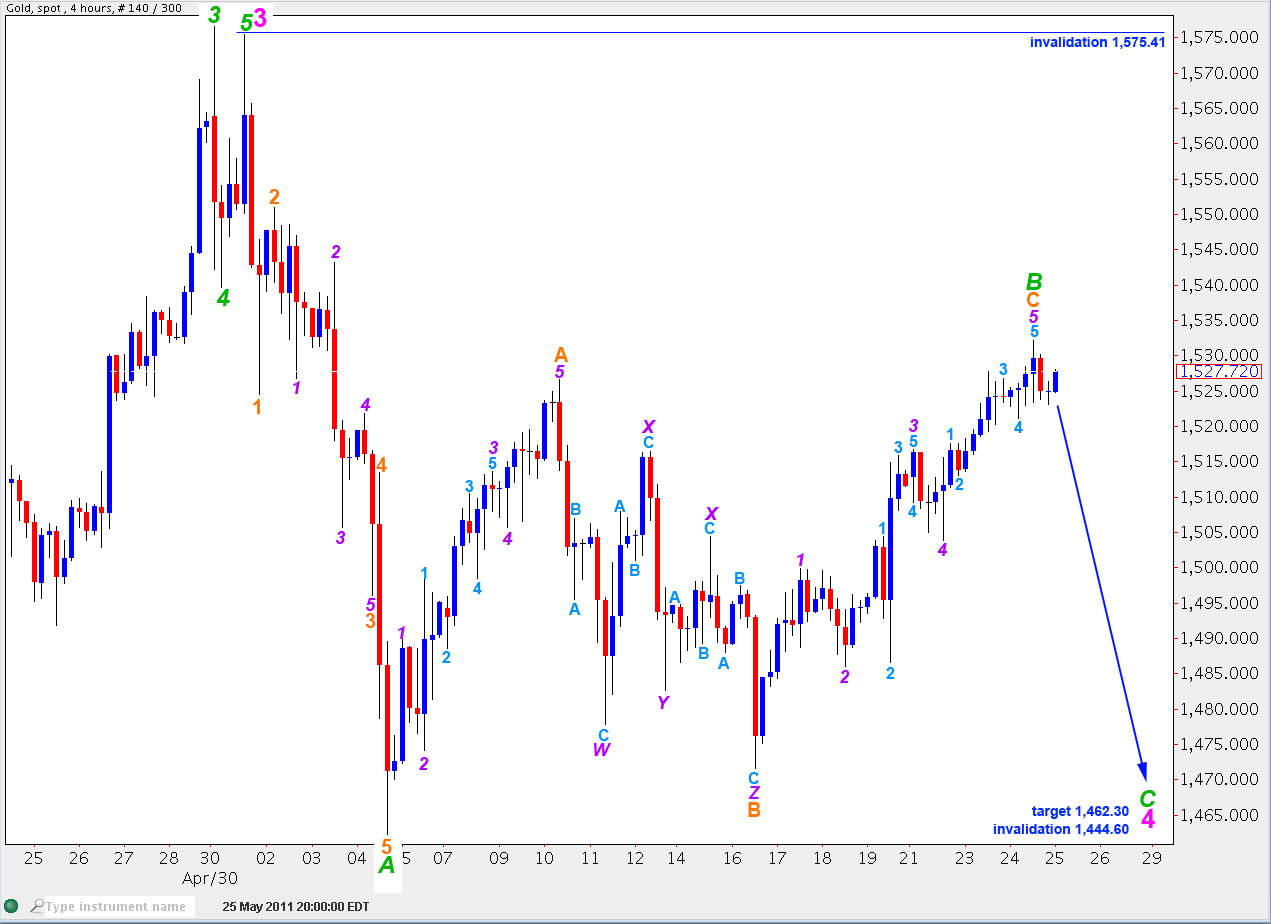
Wave B green has corrected exactly 61.8% of wave A green.
Within wave B green wave C orange is 3.76 short of equality with wave A green.
Ratios within wave C orange are: wave 3 purple is 2.54 longer than equality with wave 1 purple, and wave 5 purple is just 0.16 short of equality with wave 1 purple.
Wave C green is most likely to take price below 1,462.27 which is the low labeled A green to avoid a truncation.
At 1,462.30 wave C green will reach 0.618 the length of wave A green. This is a target for the next wave down to end. **this target has been edited from first publication**
Wave 4 pink may not move into wave 1 pink price territory. This wave count is invalidated with movement below 1,444.60.
Any further upwards movement to extend wave B green higher may not move beyond the start of wave A green. This wave count is invalidated with movement above 1,575.41.
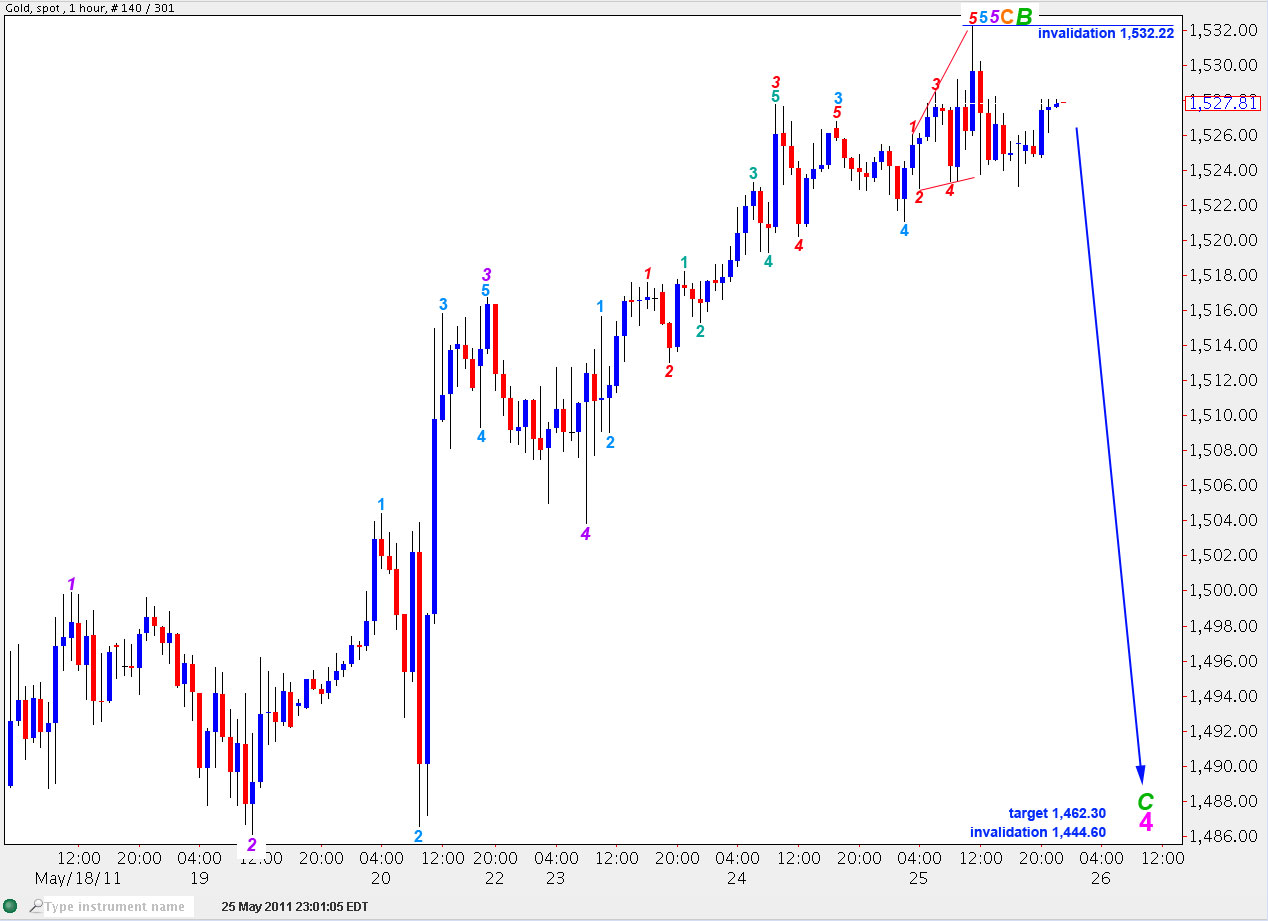
This hourly chart focusses on detail for wave 5 purple of wave C orange of wave B green, movement since last analysis.
Ratios within wave 5 purple are: wave 3 aqua is 1.38 short of 1.618 the length of wave 1 aqua, and wave 5 aqua is 0.72 short of equality with wave 1 aqua.
Ratios within wave 3 aqua within wave 5 purple are: wave 3 red is 0.91 longer than 1.618 the length of wave 1 red, and wave 5 red is 0.89 longer than 0.618 the length of wave 3 red.
Ratios within wave 3 red within wave 3 aqua within wave 5 purple are: wave 3 teal is 0.57 short of equality with wave 5 teal, and wave 5 teal is 0.12 longer than 1.618 the length of wave 1 teal.
Within wave 5 purple wave 2 aqua is a shallow correction and wave 4 aqua is a deep correction achieving the guideline of alternation.
Wave 1 aqua is an impulse and wave 5 aqua is an ending diagonal.
If this wave count is correct then gold should move lower in a five wave structure from this point. Movement above 1,532.22 would invalidate this hourly wave count.


Hi Lara
Do you see wave 5 as complete with the recent top in gold?
Wave 5 seems to have mirrored wave 1.
Thanks,
Charlie
Hi Lara,
Do you provide service daily for gold analysis?
No I don’t. I just simply do not have the time in the day to do this, and that is why I have not updated the Dow or gold for a while.
I have no plans to do this in the future.
Hi Lara thanks for the great update on gold, are you going to put out a DJIA analysis shortly, I have not seen one for a while and would be interested in hearing your thoughts on the price action. Many thanks
Hi Mario,
I currently have 7 wave counts on the S&P and have no desire to do another 7 charts for the Dow as well. There are just so many alternates possible at this stage. The situation should be clarified one way or the other in hopefully less than a week and then I will update the Dow.
I think gold is a clearer market at this time and it’s more satisfying to analyse. And I want to trade it.
I think the gold analysis will be more useful to members and readers at this time anyway.
I hope this makes sense and seems reasonable to you. I am sorry I don’t have time to do it all, but Hugo will be ready to do more analysis shortly so then we can offer more.
Thanks Lara I appreciate your reponse and understand the time it takes to do the charts. I really enjoy the gold analysis as well but I was just curious on your thoughts with the Dow chart during this difficult time in the market. I look forward to your analysis when things become a little clearer.
Keep up the great work and many thanks again.
Regards
Mario
No worries. As soon as the situation is clearer I’ll analyse the Dow.
Doing it now would not really benefit anyone, just provide a lot of charts to look at and wonder at 🙂