Elliott Wave chart analysis for the S&P 500 for 19th May, 2011. Please click on the charts below to enlarge.
I have a few members who are colour blind and in response to their requests to make the labels on the charts more readable I have altered the labels’ font size and made each degree of labeling alternate from oblique to regular font styles. To view the new wave notation table (version 2) go here. Please let me know if the new wave notation makes it easier for you to read the labels on the charts, whether you’re colour blind or not.
As expected the S&P 500 moved higher during Thursday’s session.
Because the last downwards wave moved into wave 1 pink price territory this may not be wave 4 pink. Wave 3 pink must be developing as an extended wave. We may expect momentum to increase as we move towards the middle of this third wave.
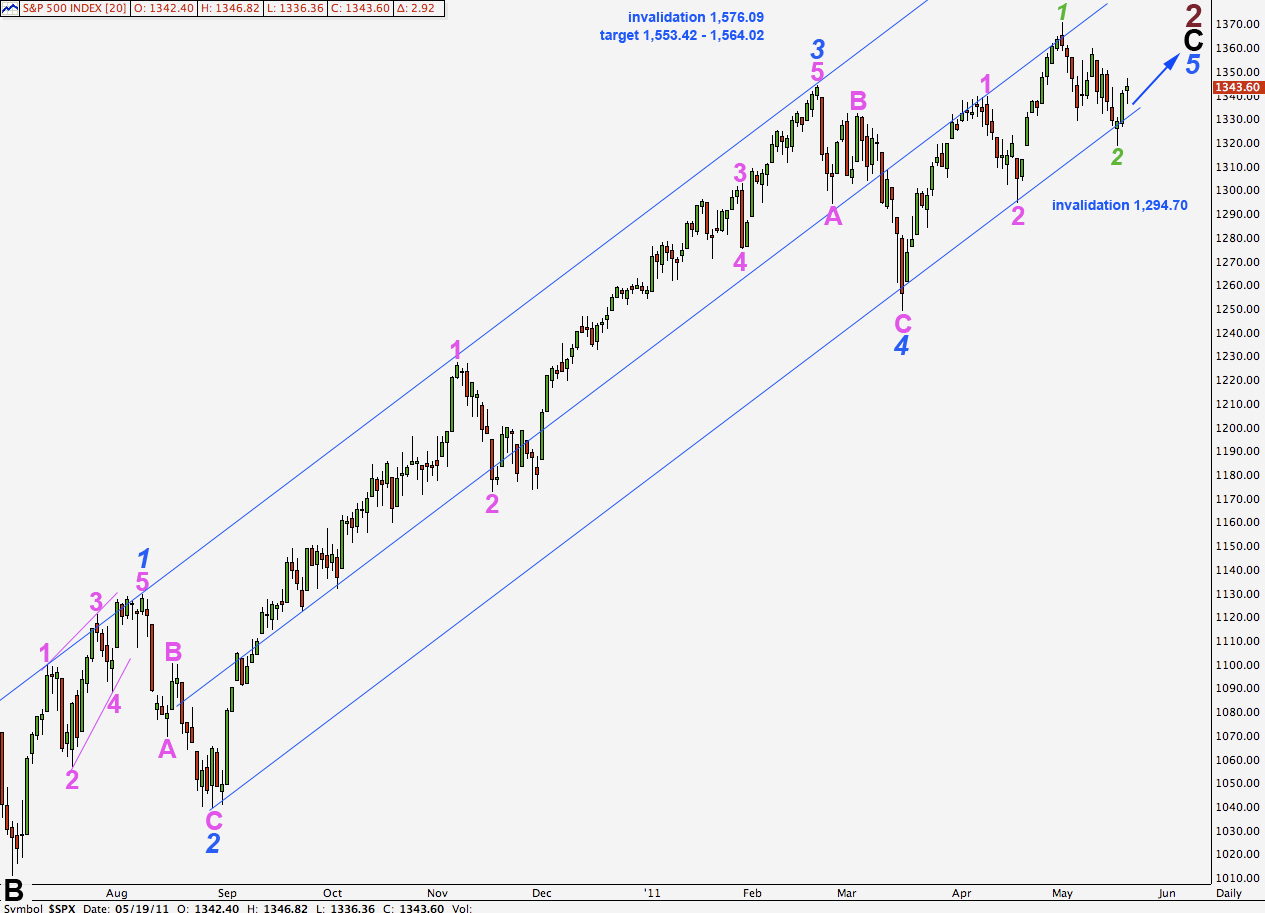
Corrections within this upwards wave may find strong support at the lower end of this trend channel on the daily chart.
It is possible that this third wave may break through the mid line and move into the upper half of the channel.
Targets remain the same. At 1,553.42 wave 5 blue will reach equality with wave 3 blue. At 1,564.02 wave C black will reach equality with wave A black. This is our long held target zone for upwards movement to end.
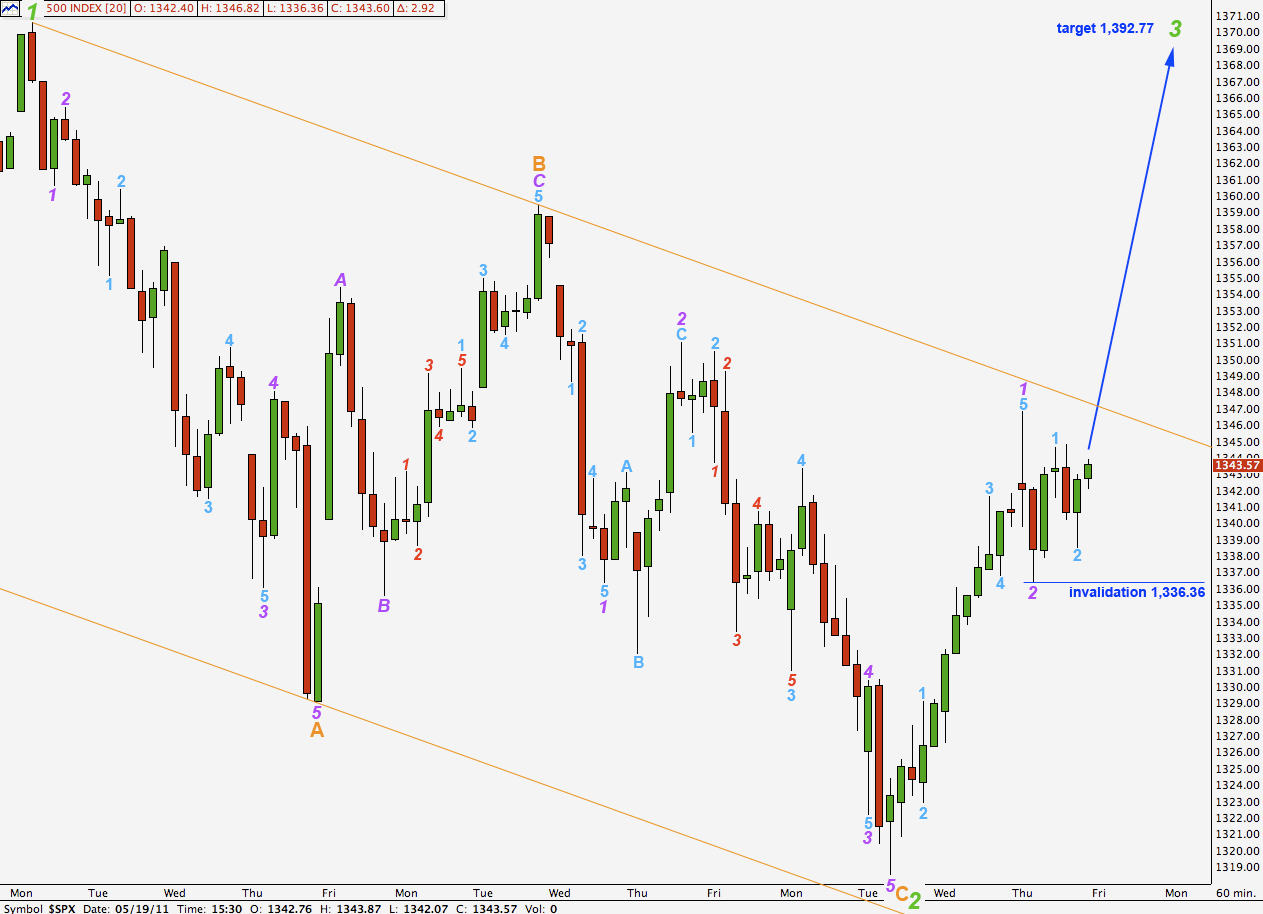
Upwards movement is finding some resistance close to the upper edge of the trend channel here on the hourly chart.
We have the first completed five wave structure upwards now on the hourly chart with a very brief and shallow second wave correction to follow it.
Ratios within wave 1 purple are: wave 3 aqua is 1.39 points short of 1.618 the length of wave 1 aqua and wave 5 aqua is just 0.52 short of wave 1 aqua.
The following upward movement labeled 1 aqua is an impulse on the 15 minute chart and so this may be wave 1 aqua of wave 3 purple. It cannot be a B wave of a flat correction.
Any further downwards movement of wave 2 aqua may not move beyond the start of wave 1 aqua. This wave count is invalidated with movement below 1,336.36.
The short to mid term target for wave 3 green remains the same. At 1,392.77 it will reach 1.618 the length of wave 1 green.


You do not present the rather obvious alternative counts consistent with other indices (RUT, MID, Nasdaq), all of which are on the same wave count as the DJI and SPX (and the DAX, FTSE etc.).
1. On Grand Cycle, it is no longer possible to class this wave up since 3/09 as “C2” since it has progressed too far (new highs in multiple indices). It is more likely B1 of 3.
In the current leg (italic blue on your charts):
A. waves labeled 1 and 2 (summer 2010) are more likely – consistent with other indices – the end of the corrective (black, Intermediate) wave 2. Wave 1 blue began 8/25/10 in the RUT, 8/27 or 8/29 in the SPX, and wave 2 ended 11/29 in all indices.
B. Wave 4 blue has not ended: A ended 3/18/11, B is what you have labeled pink 1/2 and green 1, and C began 5/2. It is an ABCDE descending wedge and we just finished D.
C. The channel you’ve drawn for what you call 2 (purple) C (black) has already been violated to the downside by the price action of 5/20/11.
Going by the lower (demand) line of the descending wedge, we should expect to see the SPX down next week to 1311 or below, especially if E overshoots as is so common with these diagonals.
After that, wave 1 pink will begin.
The correct term for a fourth wave correction A-B-C-D-E is a triangle, there is no such thing as a descending wedge in Elliott wave terminology. At least it’s not mentioned in “Elliott Wave Principle”.
I do not present the obvious alternate count as you say because it has a minimum upwards requirement. My original intention was to switch at 1,485.16.
The channel I have drawn at the time of your comment had not been “violated”.
If comments contain inaccuracies and are abrupt I am inclined to simply delete them, rather than taking an inordinate amount of time to reply.