
Elliott Wave chart analysis for the S&P 500 for 13th May, 2011. Please click on the charts below to enlarge.
Price stayed in-between the two invalidation points of both our hourly wave counts for Friday’s session. Both counts remain valid.
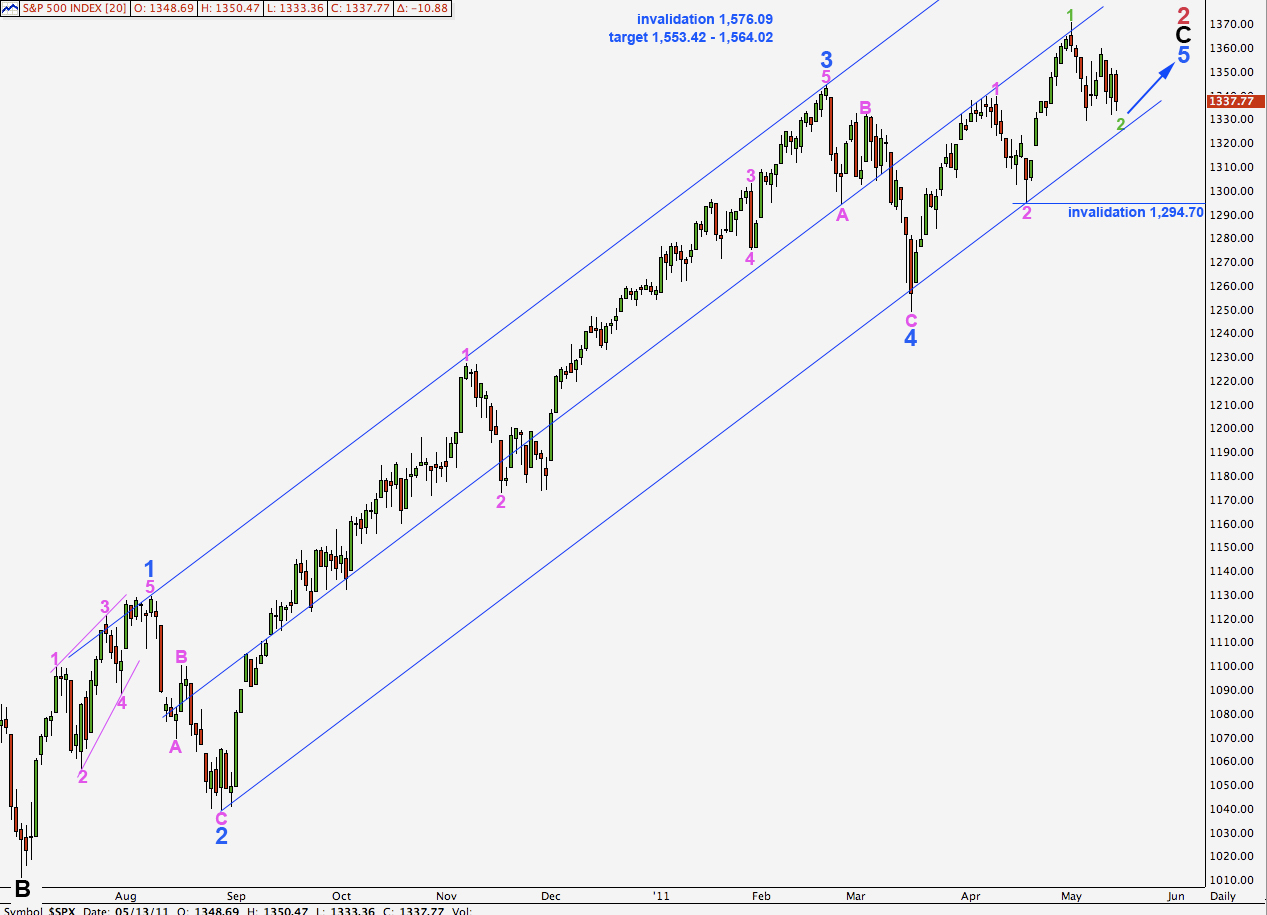
Any further downwards movement is likely to be contained within the parallel channel drawn here on the daily chart.
The target for primary wave 2 to end remains the same. At 1,564.02 wave C black will reach equality with wave A black. At 1,553.42 wave 5 blue will reach equality with wave 3 blue.
Main Hourly Wave Count.
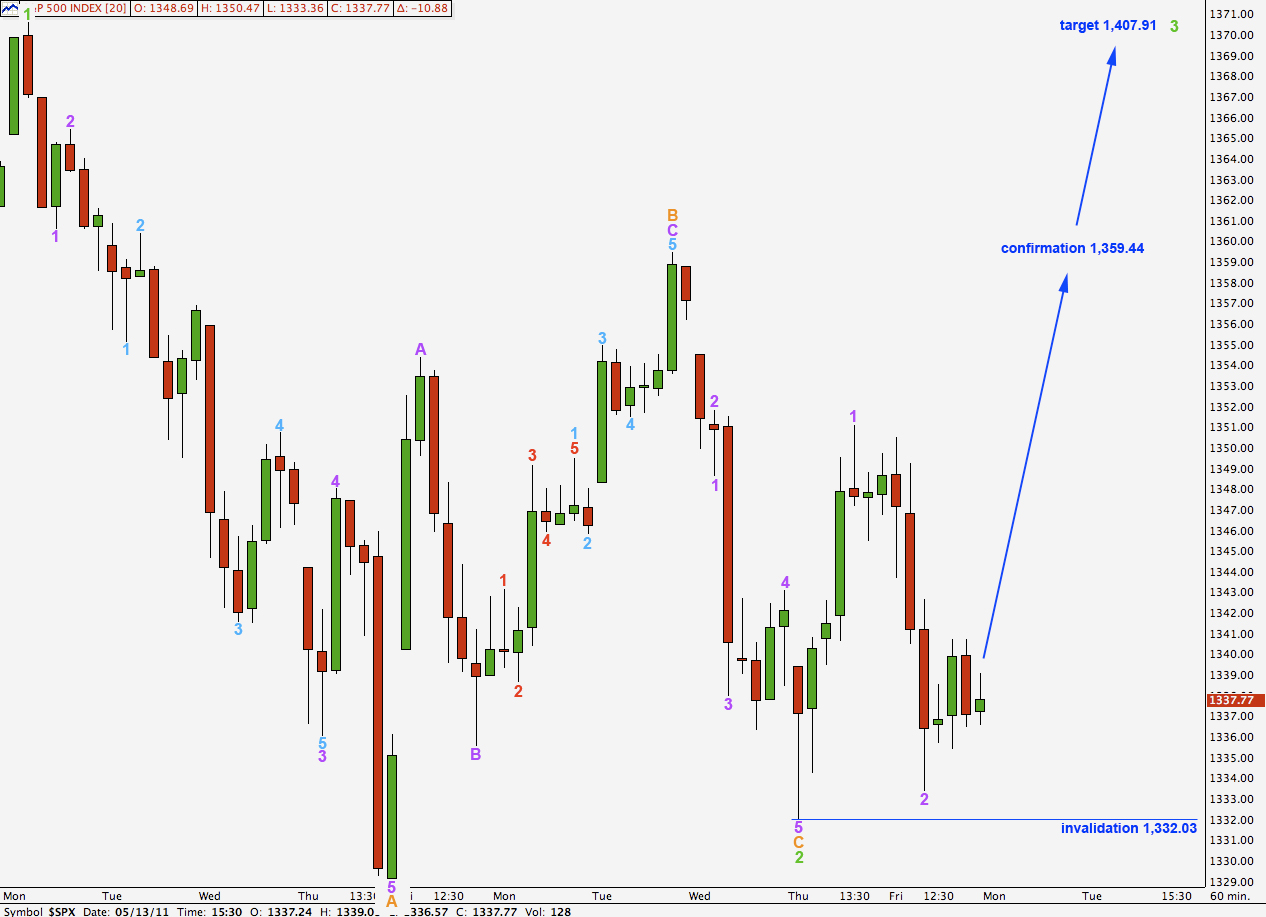
Although downwards movement for wave 2 purple remains above the invalidation point at 1,332.03, we were not expecting a deep second wave correction to start of the middle of a third wave.
This wave count remains valid. If price remains above 1,332.03 and moves sharply upwards this wave count will be correct. It may be considered confirmed if price moves above 1,359.44 as at that stage our alternate wave counts will be invalidated. At that stage we should expect continuing upwards movement towards new highs.
At 1,407.91 wave 3 green would reach equality with wave 1 green.
Alternate Hourly Wave Count.
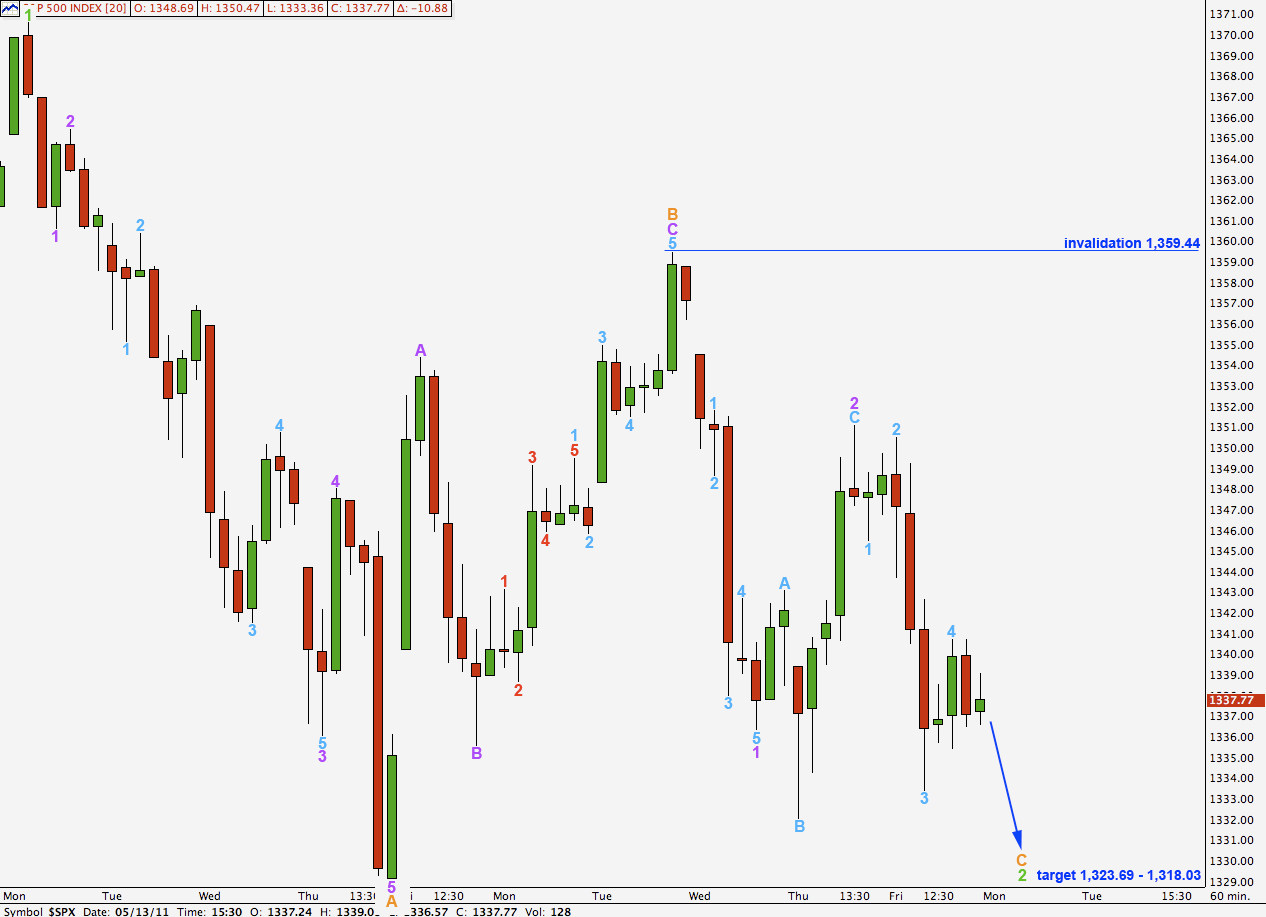
Although we saw downwards movement for Friday, which fits with this wave count, price has failed to make a new low below wave 1 purple price territory, below 1,332.03. If this wave count is correct we should see further strong downwards movement as the middle of a third wave unfolds within wave C orange.
If price moves below 1,332.03 our main hourly wave count will be invalidated and this alternate will be correct.
At that stage we should expect price to continue lower to find strong support at the lower edge of the parallel channel drawn on the daily chart. This may bring price down to the target zone at 1,323.69 to 1,318.03.
If wave 2 purple is incomplete any further upwards movement of it may not move beyond the start of wave 1 purple. This wave count is invalidate with movement above 1,359.44.
Second Alternate Hourly Wave Count.
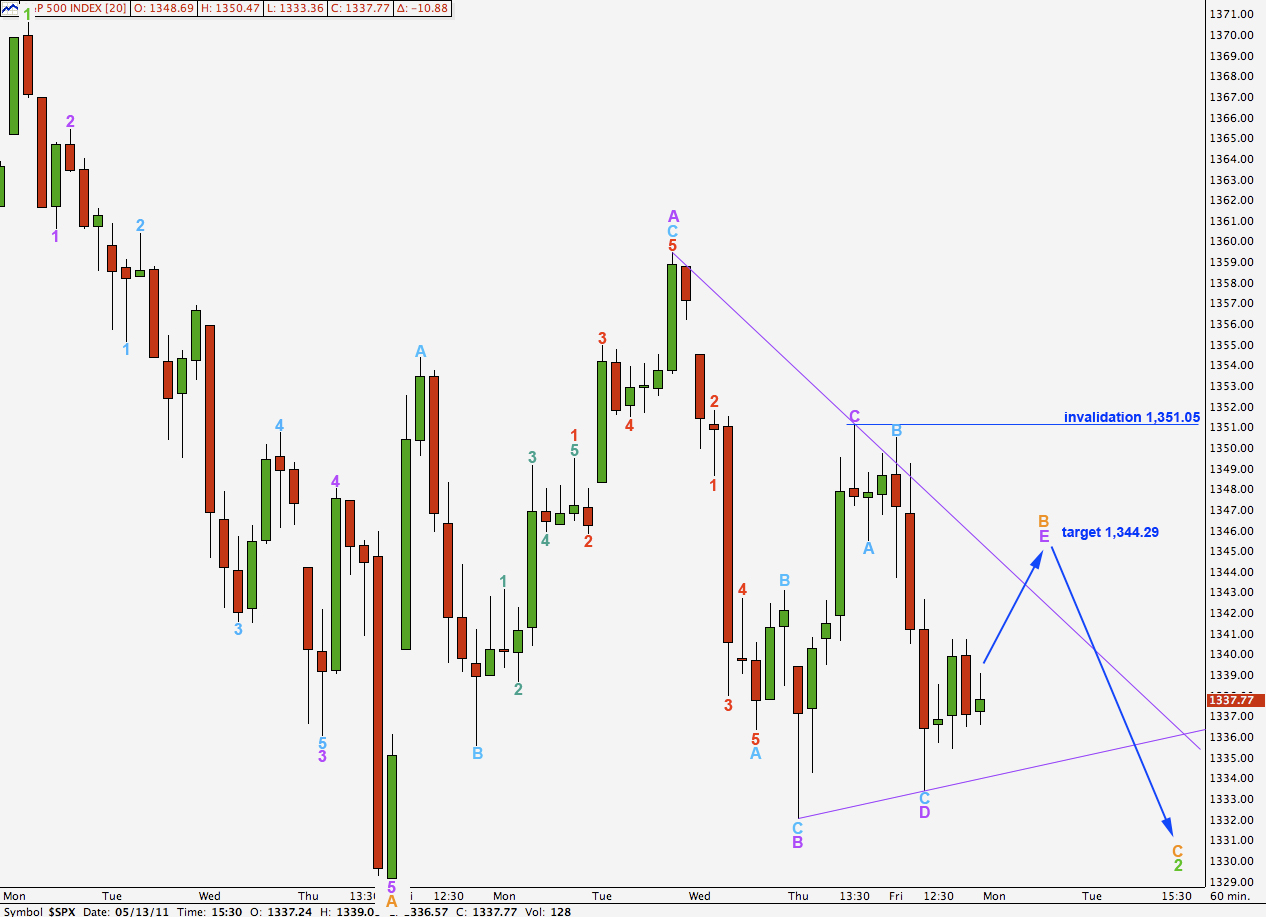
Movement over the last few days looks like a triangle may be unfolding. If this is correct then we are only in wave B orange of wave 2 green.
When the triangle is complete with a final upwards zigzag for wave E purple then we would expect a downwards wave for C orange. This may end about the lower edge of the parallel channel on the daily chart.
Wave E orange may reach 0.618 the length of wave D orange at 1,344.29.
Wave E of a contracting triangle may not move beyond the end of wave C. This wave count is invalidated with movement above 1,351.05.
Hi Lara-This certainly isn’t acting like a 3rd wave yet. One other note of interest is your DJI analysis. Can the S&P and the DJI be that different? You have the DJI in a 5th wave in your main count.
Thanks for the extra analysis this week.
Best regards. Robert