
Elliott Wave chart analysis for the S&P 500 for 9th May, 2011. Please click on the charts below to enlarge.
Price remained within a narrow band for Monday’s session and so both our hourly wave counts remain valid. Wave 2 green may have a clear zigzag structure on the daily chart when it is over.
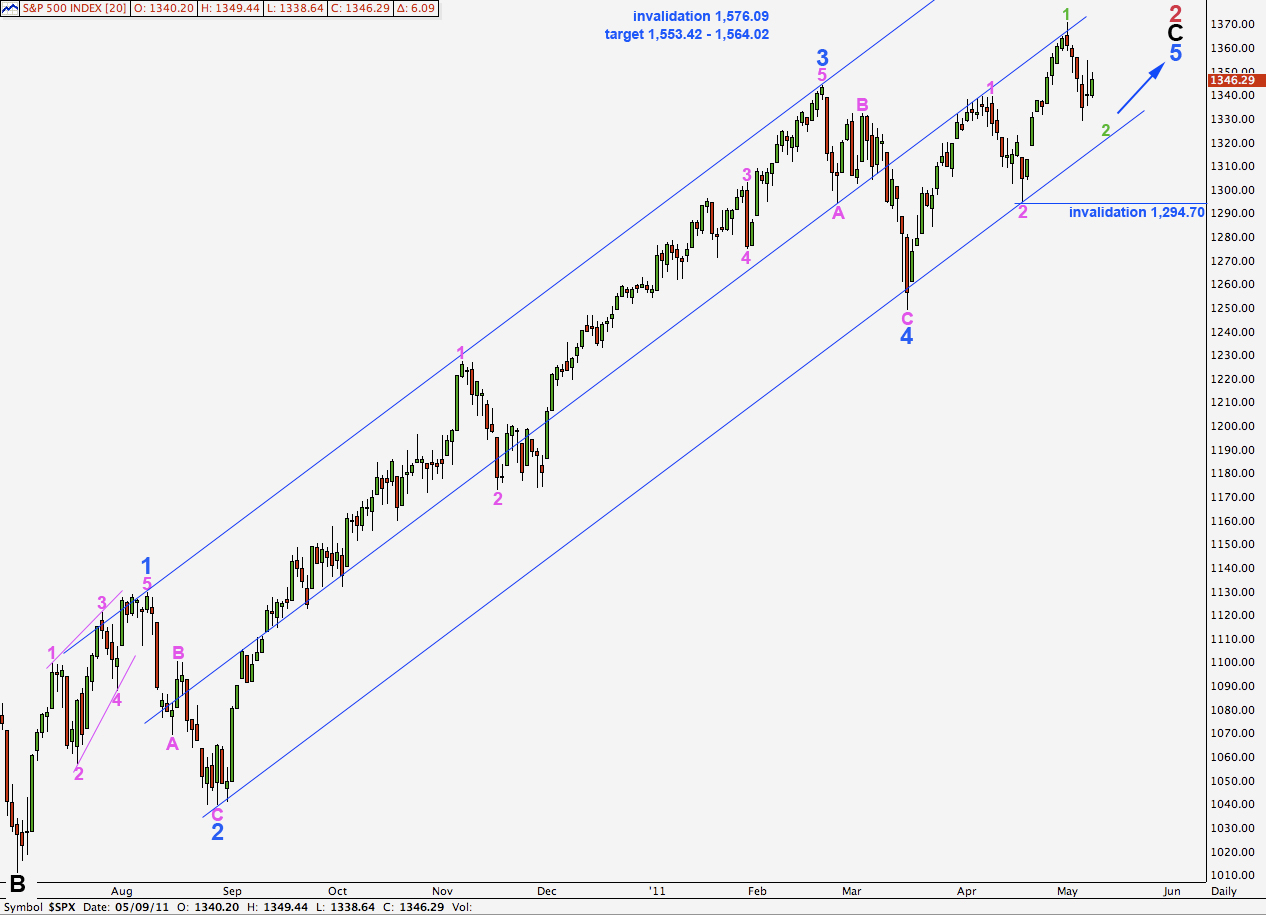
This third wave at pink degree is extending and so wave 5 blue is likely to reach equality with wave 3 blue at 1,553.42. This is very close to the point where wave C black will reach equality with wave A black at 1,564.02.
Primary wave 2 may not move beyond the start of primary wave 1. This wave count is invalidated with movement above 1,576.09.
The double wide channel should contain upwards movement and corrections until primary wave 2 is over. When we see a full daily candlestick below this channel we shall have confirmation of a trend change at primary degree.
I have three hourly wave counts for you today. It is possible to see this second wave correction as over.
Main Hourly Wave Count.
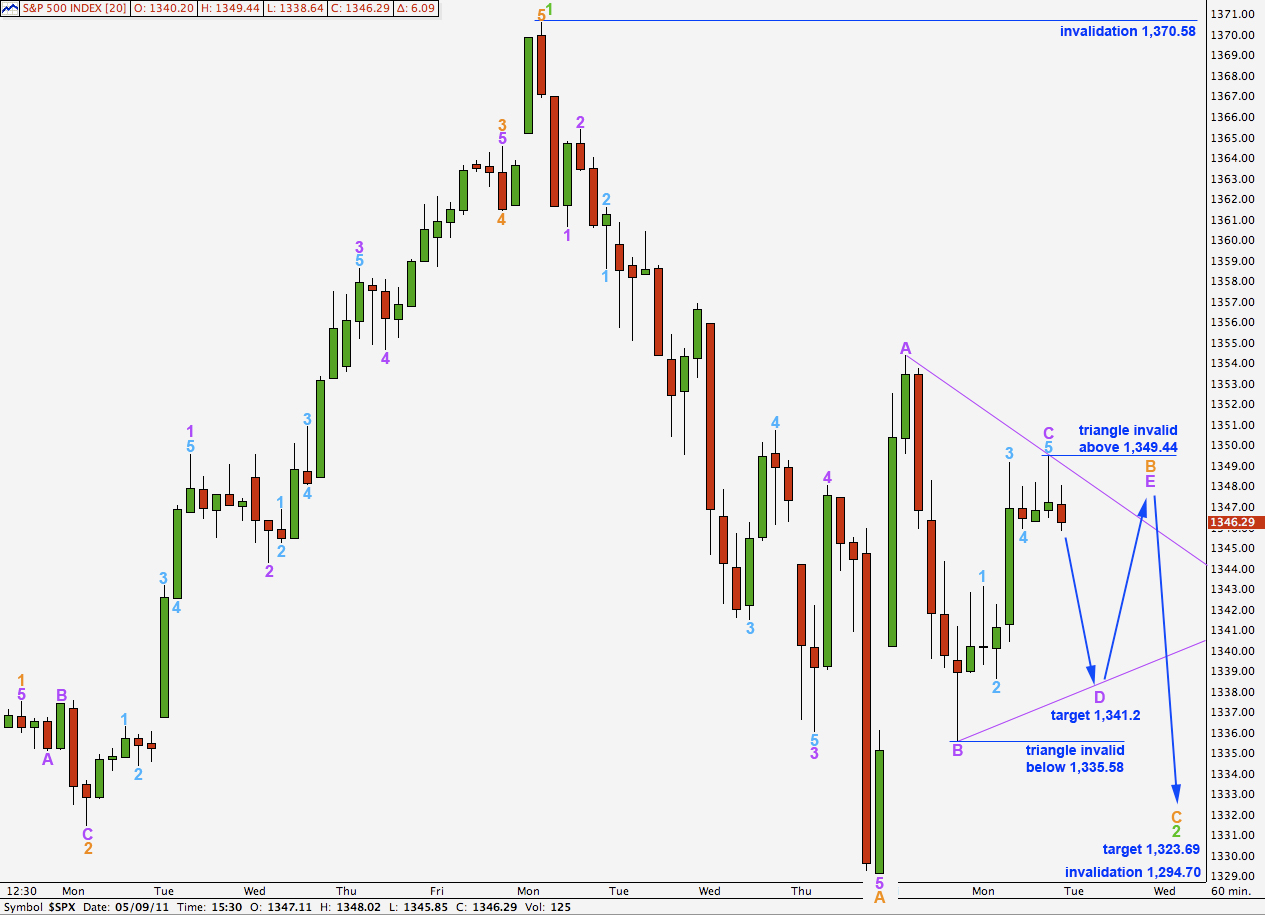
We were expecting wave B orange to continue upwards as an expanded flat correction. Monday’s sideways movement may indicate a triangle for wave B orange rather than a flat.
Wave D purple may not move beyond the end of wave B purple below 1,335.58. Wave E purple may not move beyond the end of wave C purple above 1,349.44. If price remains between these two points and completes two more zigzags then a triangle will be complete. If this occurs we will have a high probability of the next direction being downwards and it would likely be 25.19, equal to the widest part of the triangle.
If the triangle is invalidated by upwards movement then we may be seeing wave C purple continue upwards and wave B orange may be an expanded flat correction as anticipated in last analysis.
If the triangle is invalidated by downwards movement then it is possible that wave B orange was over at the high labeled C purple, with a truncated C wave. This scenario has a low probability due to the truncation.
Wave B orange may not move beyond the start of wave A orange. This wave count is invalidated with movement above 1,370.58.
First Alternate Hourly Wave Count.
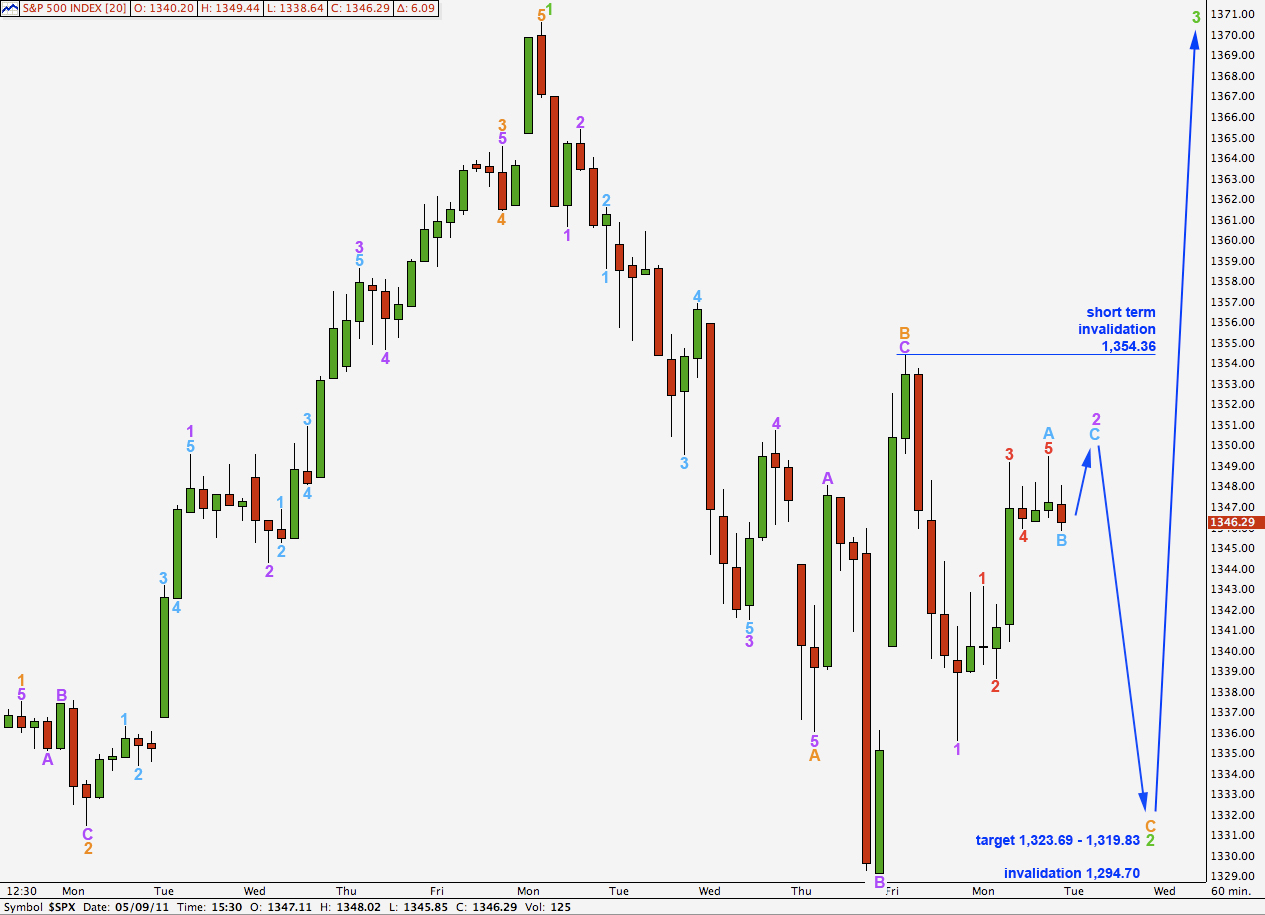
This wave count follows on from last analysis alternate hourly wave count.
This wave count has a low probability because the duration of wave 2 purple within wave C orange is out of proportion to the corrections within wave A orange at purple degree.
One small upwards movement would give wave 2 purple a complete corrective wave count.
This wave count expects further downwards movement towards the 0.618 fibonacci ratio at 1,323.69. This is fairly close to where wave C orange would reach equality with wave A orange at 1,319.83.
Movement above 1,354.36 prior to wave C orange downwards completing would invalidate this wave count.
Second Alternate Hourly Wave Count.
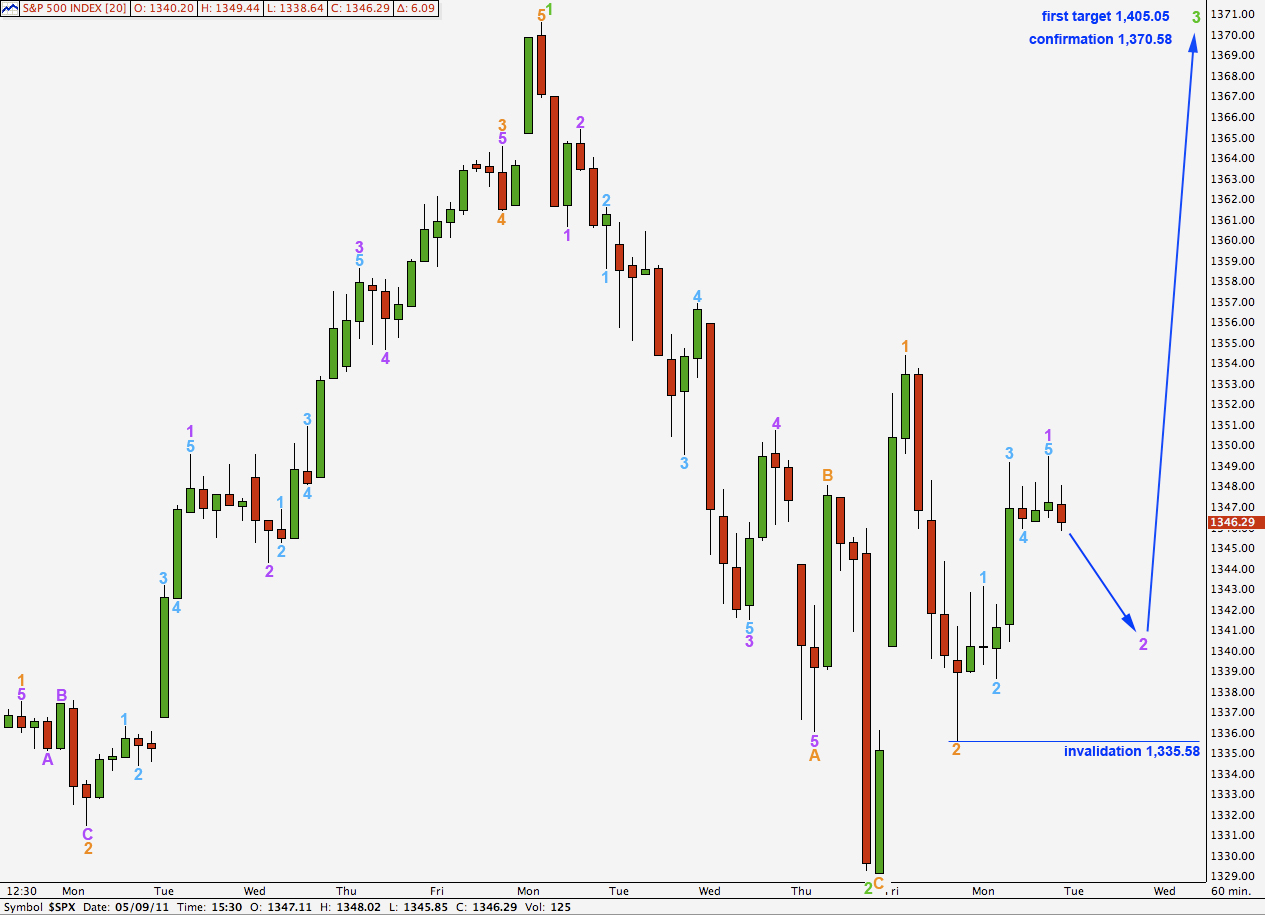
It is possible to see wave 2 green as a complete corrective structure.
Wave 3 green will reach equality with wave 1 green at 1,405.05. This would be the first target for wave 2 green to end at.
Movement above 1,370.58 would be considered confirmation that wave 3 green is underway.
Wave 3 purple may not move beyond the start of wave 1 purple. This wave count is invalidated with movement below 1,335.58.
Looks like the main count is invalidated, the 1st alternative was invalidated by fractions. The 2nd alternative seems odd given how the day is unfolding. It seems odd to already be in a 3rd wave green. What are your thoughts…
I agree, wave behaviour does not support the idea of this being a third wave up.
I expect a variation of the first wave count, where B orange is a zigzag and wave C purple upwards is underway.
This means wave C purple has to have an impulsive wave count. At this stage it is only 7, two more are needed to make it 9. The invalidation point is at 1,370.58 because B orange cannot move beyond the start of A orange.
However, the second alternate with wave 3 green underway is a valid wave count. The differentiation point is 1,370.58. If we see an increase in momentum then this wave count will make more sense.