Elliott Wave chart analysis for the S&P 500 for 6th May, 2011. Please click on the charts below to enlarge.
Upwards movement invalidated our wave count on the hourly chart but this correction remains an incomplete structure. It is most likely that we shall see more downwards movement next week before the upwards trend resumes.
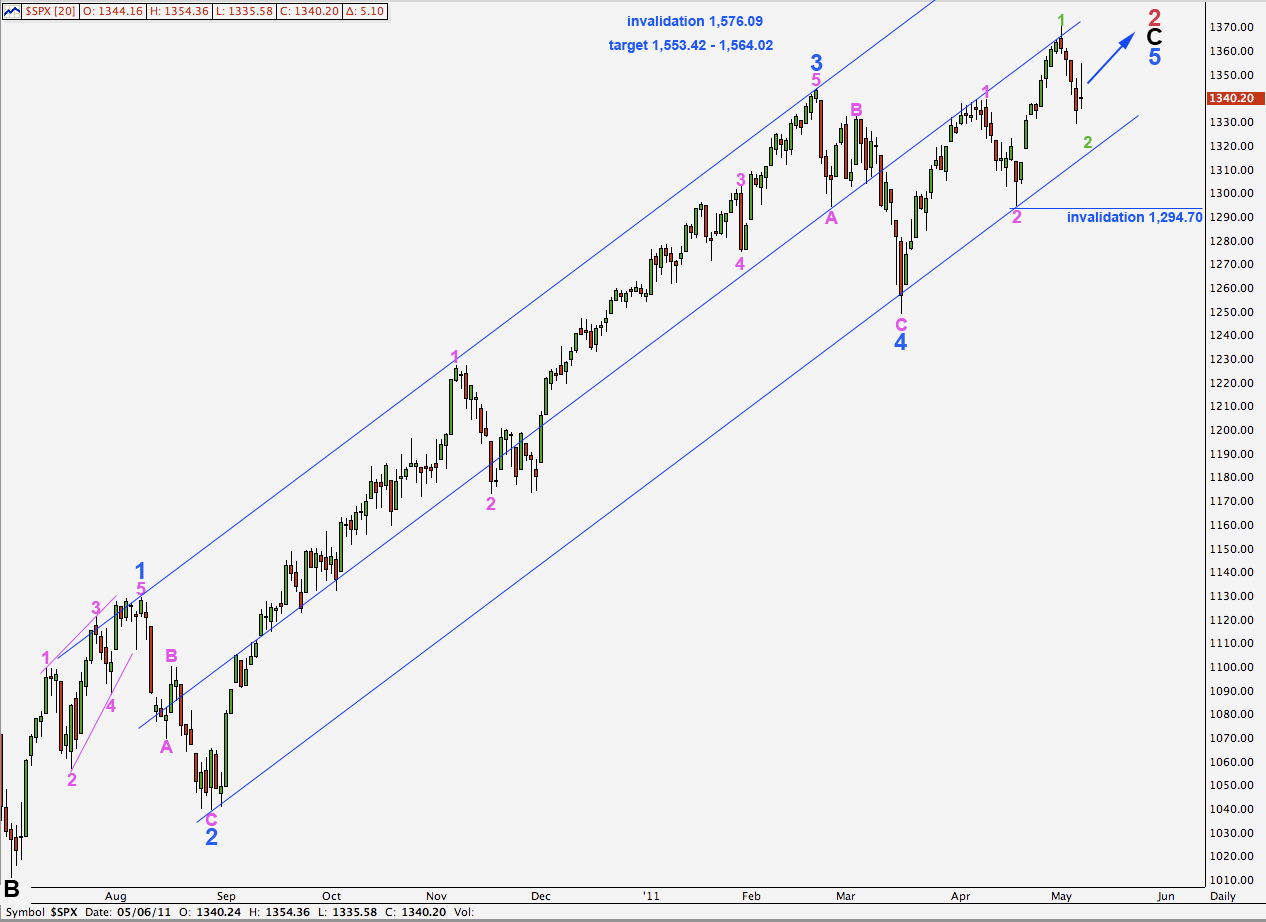
This third wave at pink degree is extending and so wave 5 blue is likely to reach equality with wave 3 blue at 1,553.42. This is very close to the point where wave C black will reach equality with wave A black at 1,564.02.
This upwards wave will have at least one more reasonable sized correction along the way for wave 4 pink.
Primary wave 2 may not move beyond the start of primary wave 1. This wave count is invalidated with movement above 1,576.09.
The double wide channel should contain upwards movement and corrections until primary wave 2 is over. When we see a full daily candlestick below this channel we shall have confirmation of a trend change at primary degree.
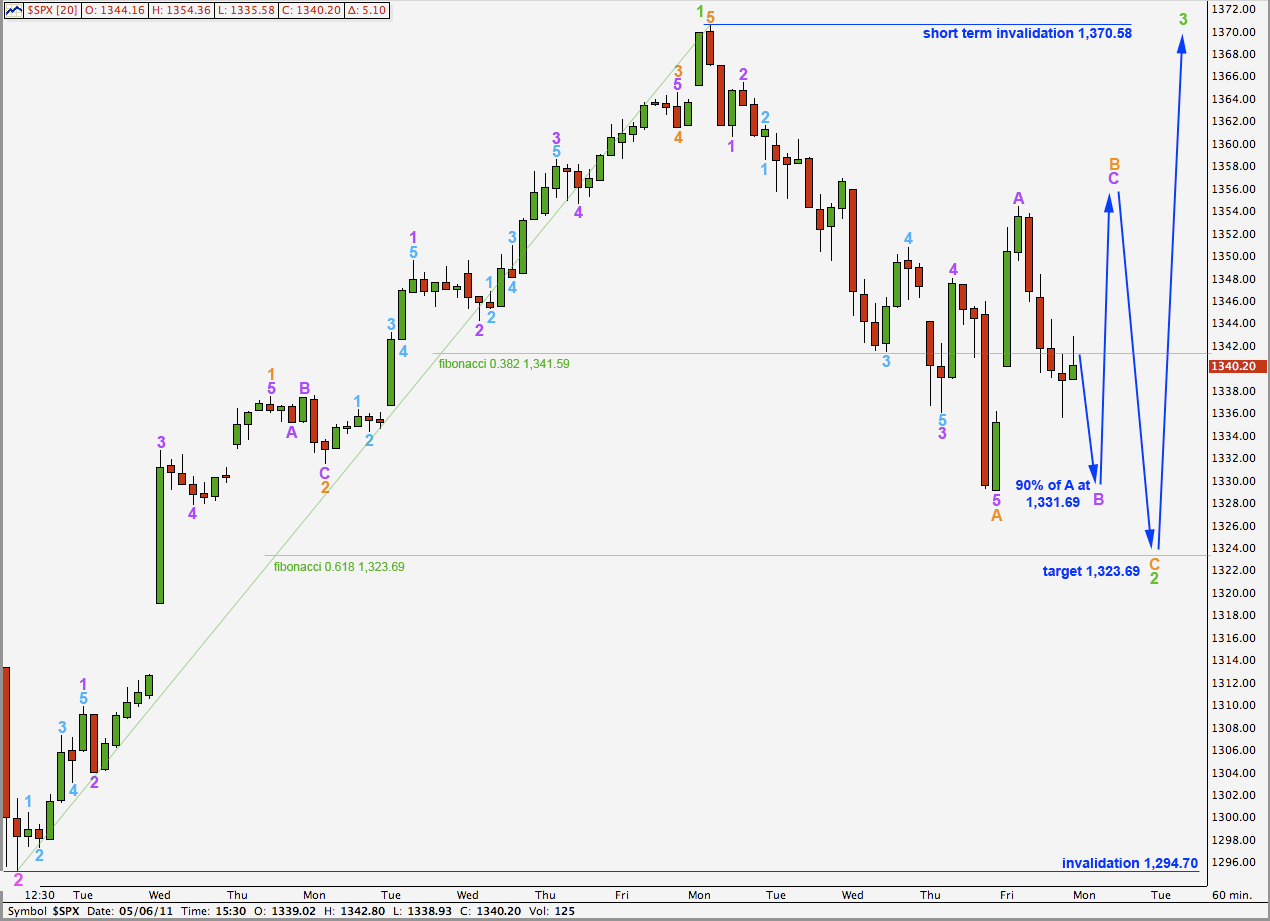
I had expected waves A and B orange were over and was simply expecting further downwards movement for wave C orange to complete wave 2 green. This was not the case and last analysis labeling for wave A orange was incorrect.
Wave A orange has an extended third wave within it. Ratios within wave A orange are: wave 3 purple is 2.19 points short of 2.618 the length of wave 1 purple and wave 5 purple is just 0.1 point short of 0.618 the length of wave 3 purple.
Ratios within wave 3 purple within wave A orange are: wave 3 aqua is 1.07 points longer than 1.618 the length of wave 1 aqua and there is no fibonacci ratio between wave 5 aqua and either of 1 or 3.
Wave B orange is an expanded flat correction. Wave B purple is a 158% correction of wave A purple and wave C purple has no fibonacci ratio to wave A purple, although it is just 1.29 points short of twice the length of wave A.
Within wave C orange wave 2 purple may not move beyond the start of wave 1 purple. This wave count is invalidated in the short term by movement above 1,354.36. If this occurs then the alternate is the best explanation that I can see at this stage.
At 1,319.83 wave C orange will reach equality with wave A orange. This will bring price to almost perfectly touch the lower edge of the blue trend line on the daily chart.
At that point a strong third wave upwards should develop.
Technically, we may even count wave C orange, and wave 2 green, as over at the low labeled 1 purple resulting in wave C orange being truncated. Although this is technically possible such a wave count would have a very low probability.
The probability that price will come to just slightly overshoot the 0.618 fibonacci ratio is high.
Wave 2 green may not move beyond the start of wave 1 green. This wave count is invalidated with movement below 1,294.70.
Alternate Hourly Wave Count.
I have considered two alternate possibilities and this is the most likely.
Downwards movement to the low labeled A orange has an impulsive wave count and this could possibly be wave A is just over here.
Ratios within wave A orange are: wave 3 purple has no fibonacci ratio to wave 1 purple and wave 5 purple is just 0.7 points longer than 0.618 the length of wave 3 purple.
Within wave 3 purple within wave A orange there are no fibonacci ratios between waves 1, 3, and 5 aqua.
The ratios for this alternate are not as good as for the main hourly wave count. This reduces the probability that this alternate is correct.
The subdivision of wave A purple within wave B orange is most easily seen as a three on the 15 minute chart. This would indicate that wave B orange is unfolding as a flat correction (or a triangle). A flat requires wave B to be at least 90% the length of wave A at 1,331.69. A triangle does not require a minimum length for wave B purple. Both a flat and a running triangle would require movement to a new low below 1,329.17 and this downwards movement would have to be in a three wave structure.
Thereafter, wave C purple upward would most likely take price above 1,354.36 if wave B orange was a flat or an expanding triangle.
If wave B orange was a contracting triangle this would show itself fairly soon as sideways movement in a decreasing range.
This wave count has a low probability and would only make sense if we saw movement above 1,354.36 in the short term.
Subdivisions do not fit well at all. This also reduces the probability that this wave count is correct.


Hi Lara-Here is an alternate count which I like. The B wave is a bit tricky but I think it can be counted a couple of ways: 1. as an ABC (zigzag followed by a flat, or 2. as WXY).
What do you think of this count?
Thank you for your consideration.
Robert
http://www.screencast.com/t/03Use9bX