
Elliott Wave chart analysis for the S&P 500 for 13th April, 2011. Please click on the charts below to enlarge.
We were expecting a little upwards movement yesterday and we did get some, but not as much as expected. Thereafter, a new low followed.
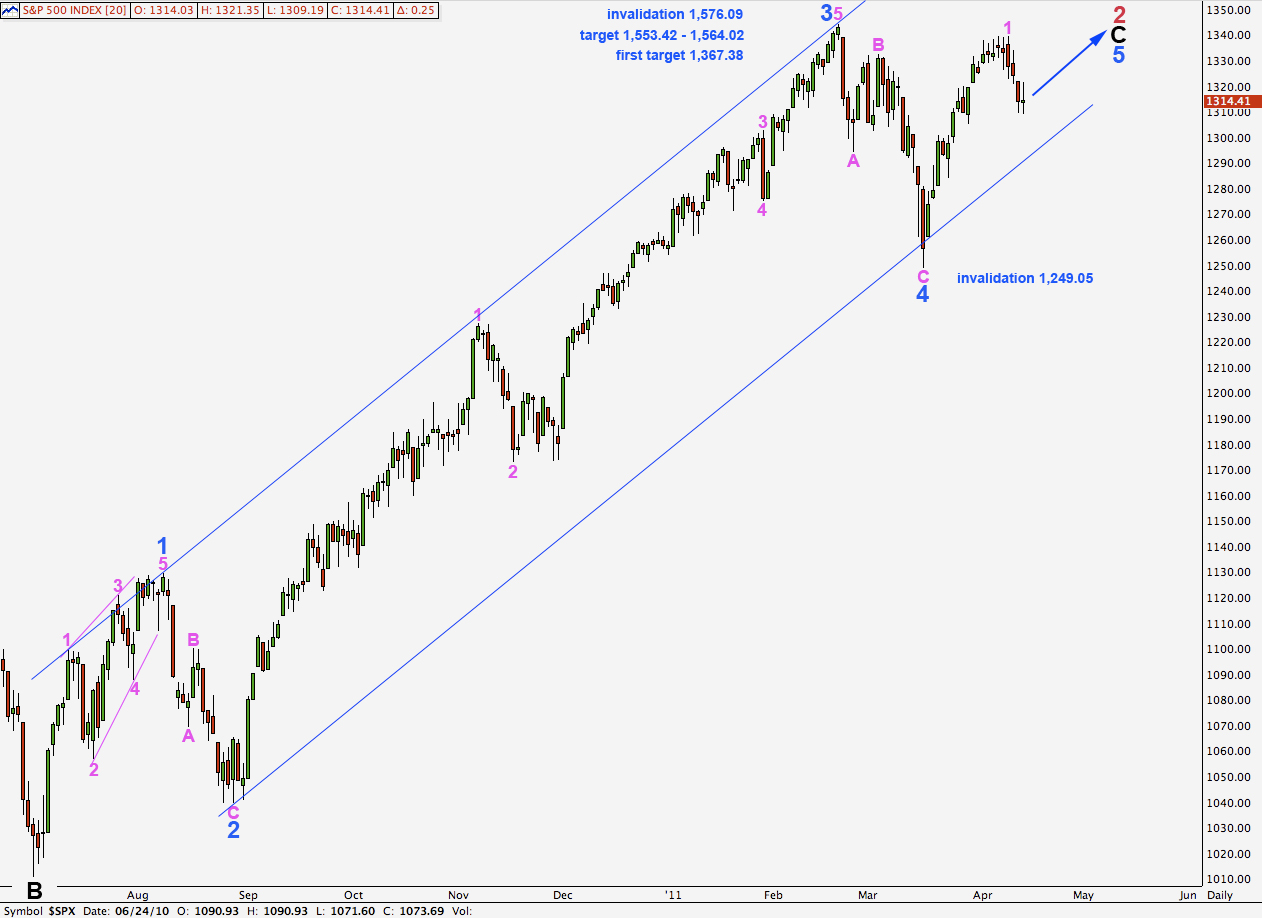
Wave 2 pink is incomplete and should move lower yet before it is over.
Wave behaviour still does not support the idea that primary wave 3 is here. When this second wave correction is over we should see a resumption of steady upwards movement towards targets for wave 5 blue on the daily chart.
Wave 2 pink may not move beyond the start of wave 1 pink. This wave count is invalidated with movement below 1,249.05.
Within wave 2 pink we have two possibilities and so we have two hourly wave counts below.
Main Hourly Wave Count.
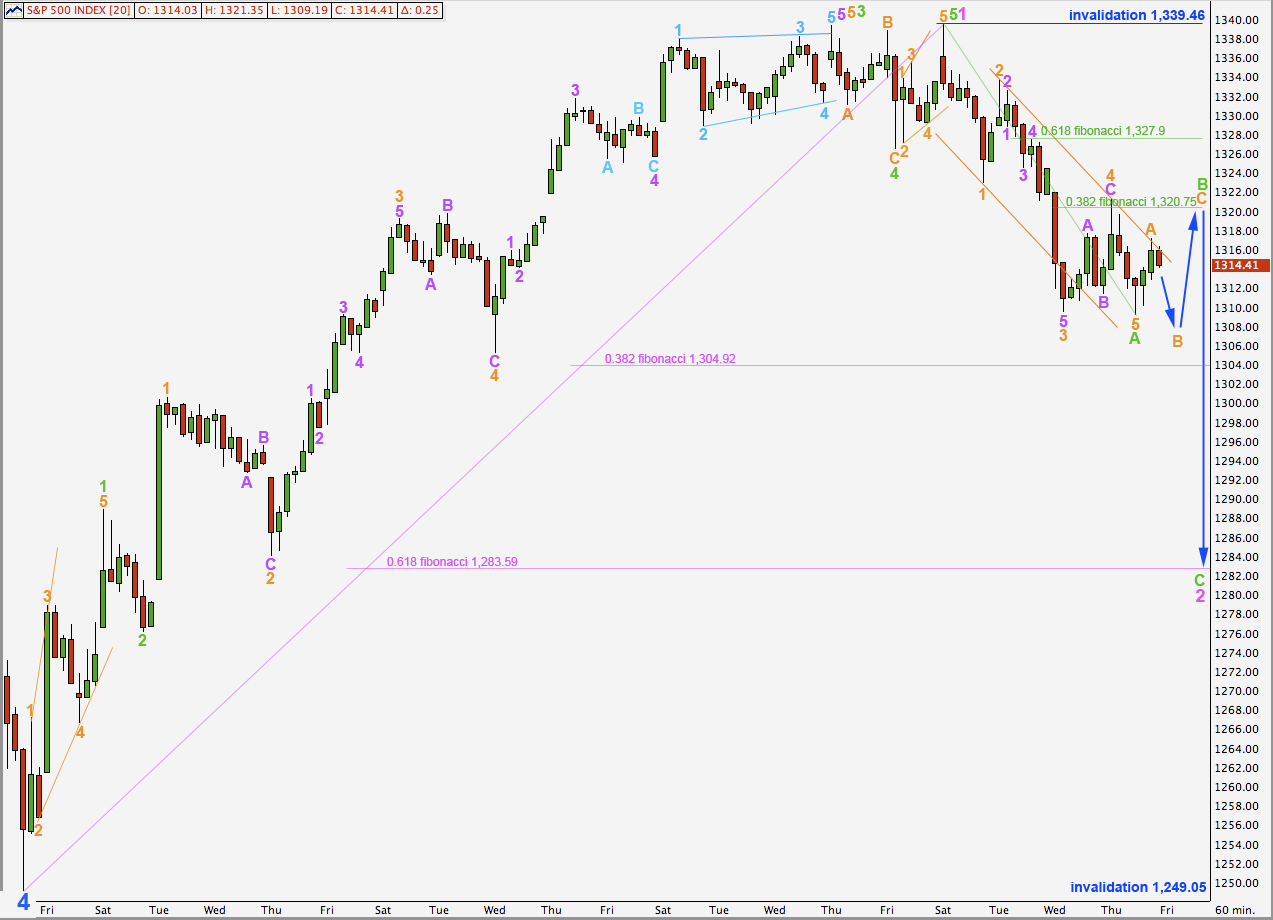
My analysis of the subdivision of wave 1 orange must have been incorrect yesterday. Wave 4 orange did not overlap wave 1 orange price territory and so wave A green is unlikely to be a leading diagonal. It is more likely to be a simple impulse. Wave 5 orange when viewed on the 15 minute chart is a perfect impulse.
Ratios within wave A green are: wave 3 orange is 2.47 points short of 1.618 the length of wave 1 orange and wave 5 orange is 1.95 points longer than 0.618 the length of wave 1 orange.
Wave B green is most likely to break out of the narrow orange trend channel drawn here about wave A green. It should be a clear three wave structure which shows up on the hourly chart as a three and is most likely to correct to about the 0.382 fibonacci ratio of wave A green, which is at 1,320.75.
Movement above 1,317.16 would provide confirmation of this wave count as that is where the alternate below is invalidated.
When we have an end to wave B orange within it we may expect wave C orange upwards to reach equality with wave A orange and so be about 7.97 points in length.
Wave B green may not move beyond the start of wave A green. This wave count is invalidated with movement above 1,339.46.
Alternate Hourly Wave Count.
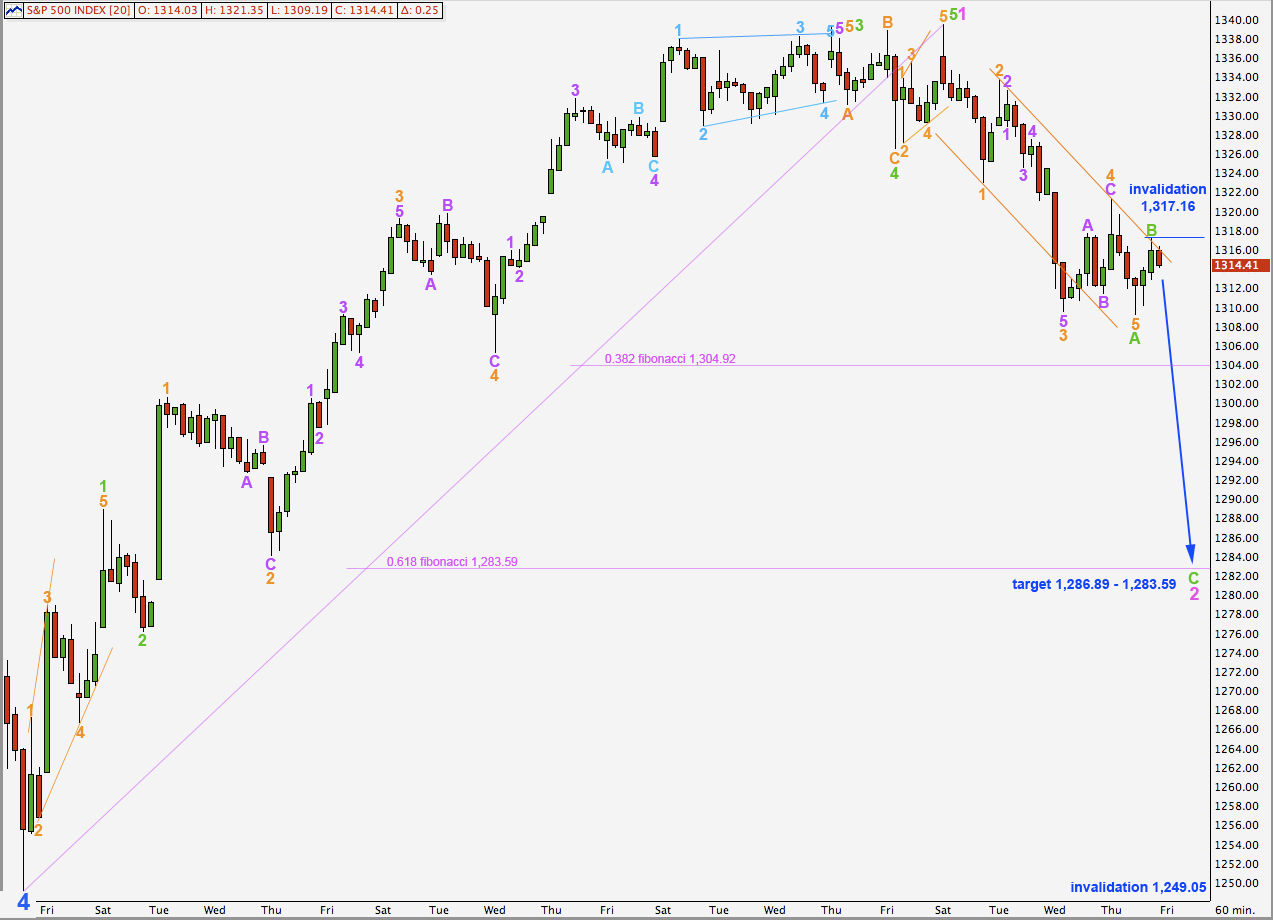
The upwards movement labeled here B green to end Wednesday’s session is a three wave structure when viewed on a 15 minute chart. Wave B green may have been over there.
If this is correct then Thursday’s session should see a five wave downwards structure for wave C green begin. A second wave correction within this may not move beyond the start of the first wave and so this wave count is invalidated with movement above 1,317.16.
At 1,286.89 wave C green will reach equality with wave A green. This point is close to the 0.618 fibonacci ratio for wave 1 pink which is at 1,283.59. This is our target for downwards movement for Thursday’s session.
Hi Lara.
Can you please verify your setup on the X-Axis on your hourly charts? It looks to me like the days along the X-Axis do not correspond properly to the bars plotted (i.e. the hourly bars from yesterday are plotted appear over a Wed-Fri timeframe).
Please advise.
Thanks.
Live charts are showing the data for me in my time zone and I’m +13GMT. It’s taking the time from my computer.
I’ve changed the time zone to EST on my laptop and I’ll use this for our charts in future.
Tomorrow it will look correct.
Well, that was an easy explaination! I wasnt so concerned…but just wanted to make sure that everything I was seeing was correct (chart wise).
Thanks for your consideration and making the change (but if members start to complain about the change, please feel free to change it back).
Rgds.