
Elliott Wave chart analysis for the SPX500 for 30th March, 2011. Please click on the charts below to enlarge.
Main Wave Count.
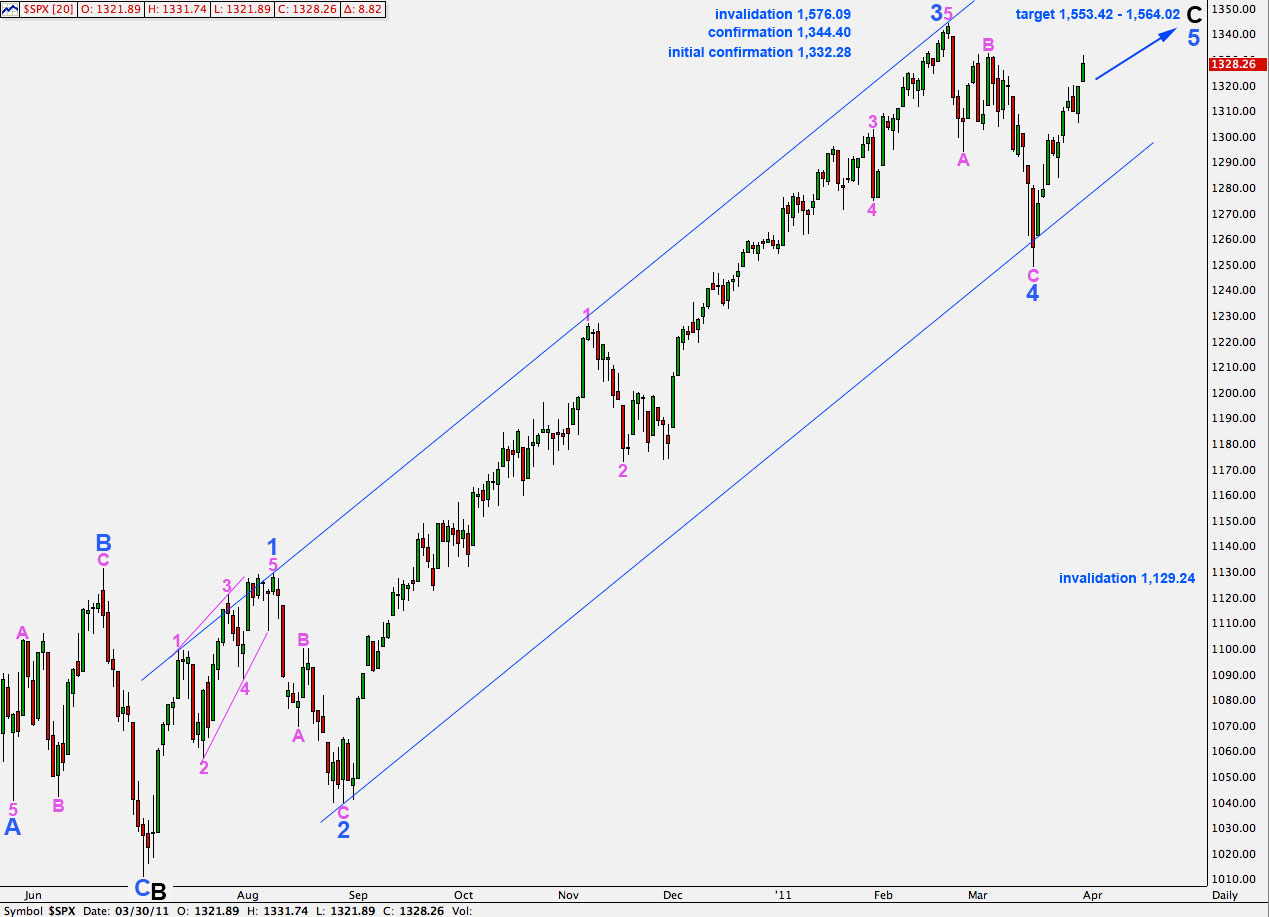
As expected the S&P moved higher in Wednesday’s session. We should see more upwards movement tomorrow towards the short term target on the hourly chart, before a short term trend change for a small fourth wave correction.
Overall we should see continuing upwards movement from the S&P for some time.
At 1,553.42 wave 5 blue will reach equality with wave 3 blue. At 1,564.02 wave C black will reach equality with wave A black.
This wave count expects no new all time highs for the S&P above 1,576.09.
Movement above 1,332.28 will invalidate our alternate wave count and confirm this main wave count.
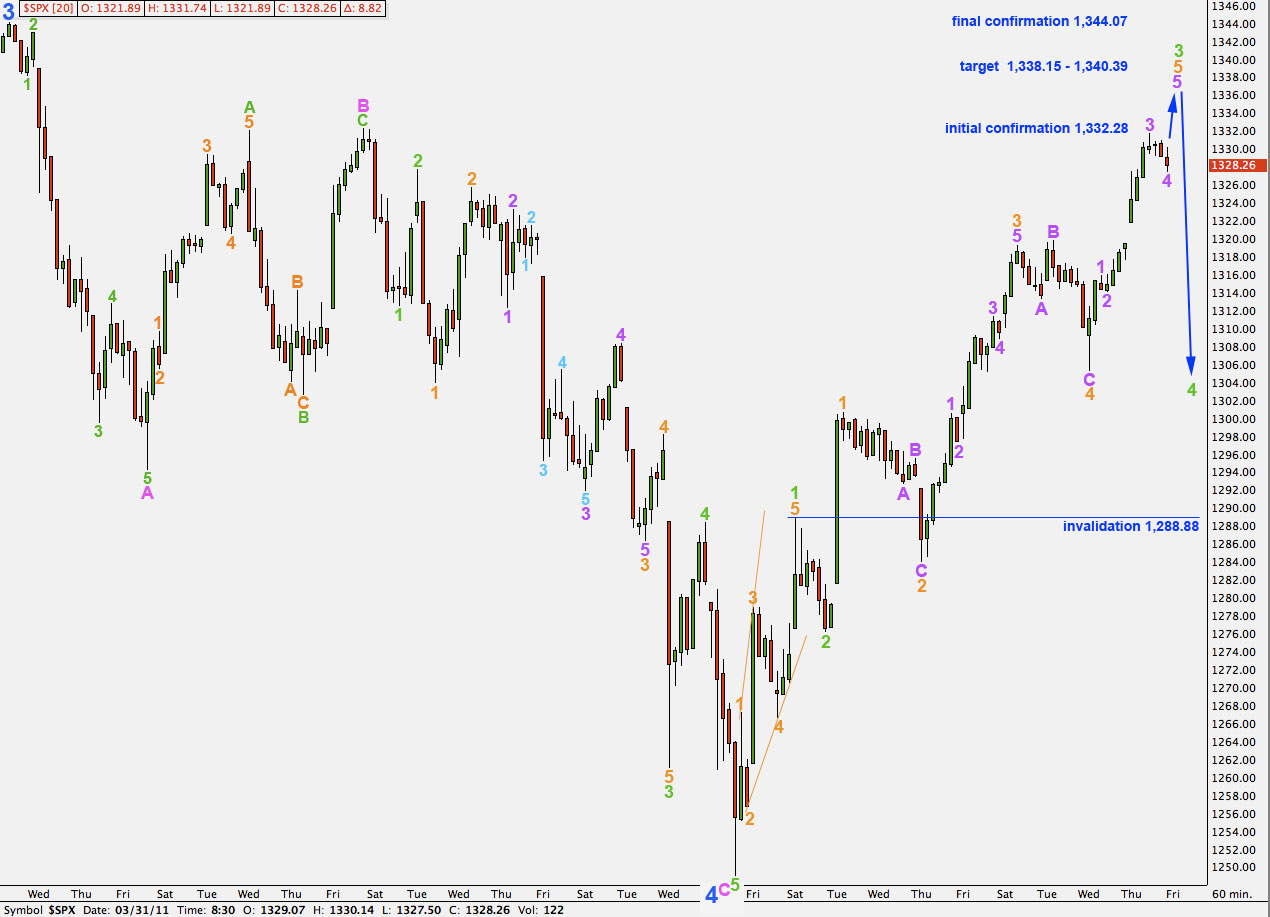
Wave 5 orange has moved price higher as expected. It is not yet a complete impulsive structure.
Within wave 5 orange so far wave 3 purple is just 0.08 longer than 1.618 the length of wave 1 purple.
At 1,338.15 wave 5 purple (if it began at 1,327.50 and if wave 4 purple does not move lower) will reach equality with wave 1 purple.
At 1,339.49 wave 3 green will reach 1.618 the length of wave 1 green.
At 1,340.39 wave 5 orange will reach equality with wave 1 orange.
We have a 2.24 point wide target zone with a high probability.
When the final upwards movement to end wave 3 green is complete then we should expect wave 4 green to develop downwards.
Wave 4 green may not move into wave 1 green price territory. This wave count is at that stage invalidated with movement below 1,288.88.
We may expect wave 4 green to last about a week or so.
Alternate Wave Count.
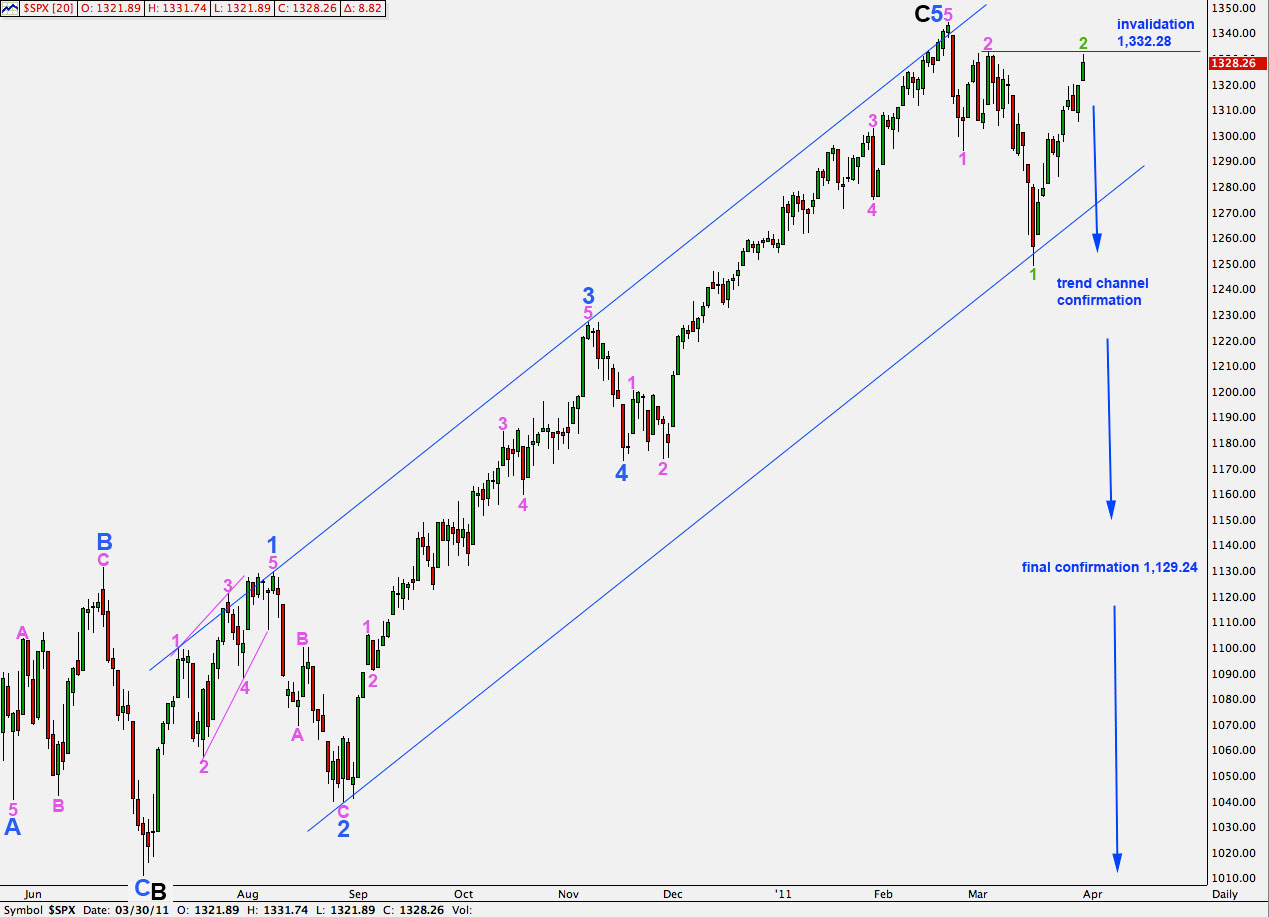
This wave count remains technically valid for the S&P500. However, for the Dow and Russell 2000 the counts were invalidated by upwards movement.
This wave count now has a very low probability but it remains technically possible.
Movement above 1,332.28 may be considered invalidation of this wave count.
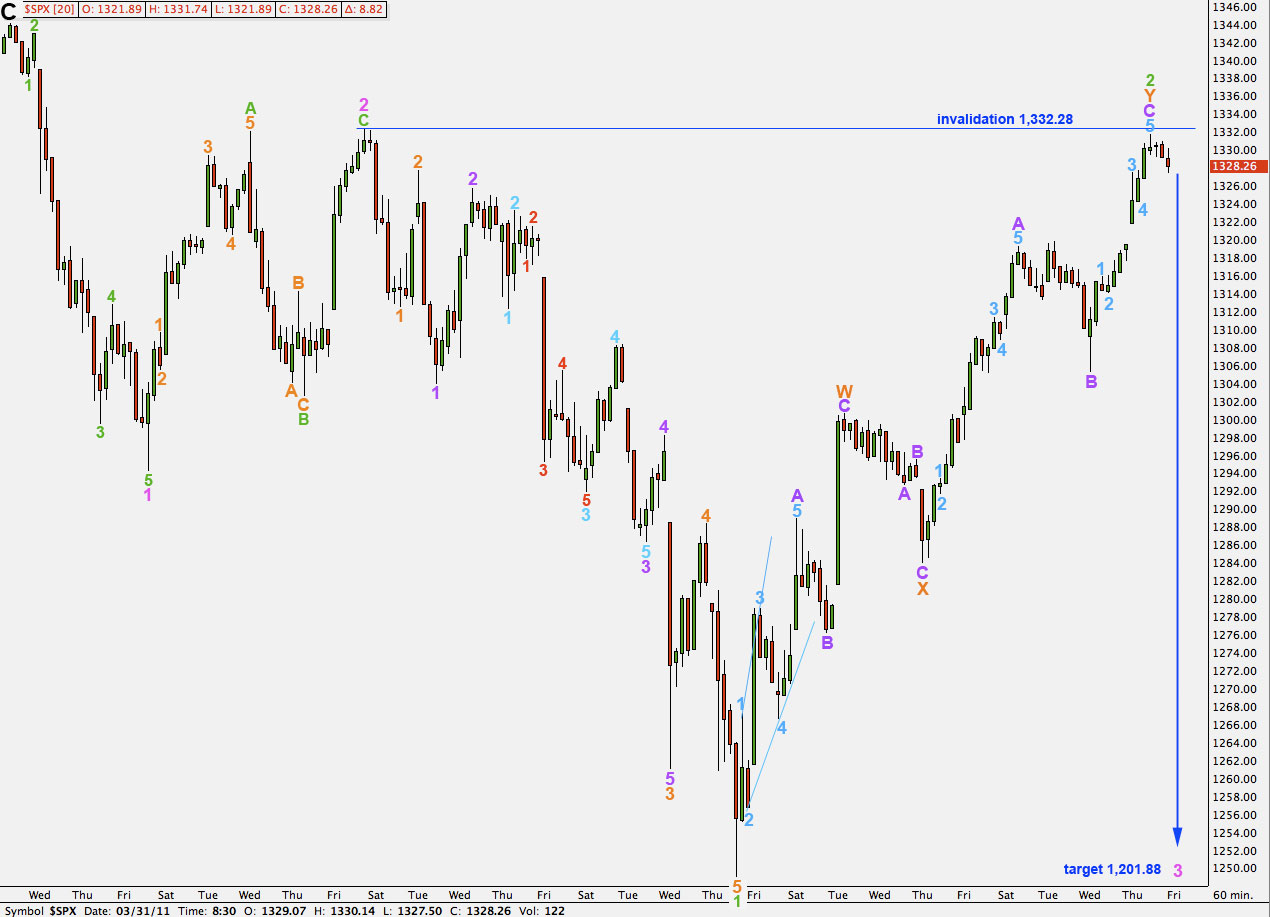
Any further upwards movement for wave 2 green may not move beyond the start of wave 1 green. This wave count is invalidated with movement above 1,332.28.
Hi Robert, thanks for the link to your chart! I really like that wave count. I’m going to chart it and do the math on it this weekend and perhaps even use it as our main count. We will see.
You would call that Y wave a zigzag with a truncated C wave. It looks okay, but I’m going to carefully check the subdivisions fit. The upwards wave within it must be a B wave and so a 3 would have to fit in there for this to work.
perhaps the y position in the flat I’m referring, or proposing, is not a running flat since the B wave is not typical to a runninng flat. so what shall I call it? a regular flat with a short C wave? (-:
Robert
Hi Lara-The other day I inquired about the possibility that the correction from 4/24-8/25/10 could possibly have been a combination W-X-Y and that we are now finishing Minor Wave 5 od PW2. The reason I favor this is that I do not like the look of W3 in our primary wave count. Of course, the wave count I propose is predicated on a rare running flat in the Y position.
The other thing that concerns me is that the Russell 2000 is very near ALL TIME new highs for the index. The Transportation Index is not far behind. This makes no sense to me given the fact that the entire world economy is drowning in debt and the U.S. in particular is teetering on
brink of collapse as it is being kept afloat by the Fed’s 3 year policy (ponzi) of free money (0% interest rates) and the promise of infinite leverage. At some point the world will have to give up the idea the the U.S. is too big to fail as their own survival becomes paramount.
Hope I haven’t bored you too much but I feel much better now having gotten that off my chest. (-:
Very best regards,
Robert
http://www.screencast.com/t/6Fagx5sQA1