
Elliott Wave chart analysis for the SPX500 for 20th March, 2011. Please click on the charts below to enlarge.
Thank you to Dennis King for a clear explanation of the data I was using, and the difference between it and the underlying S&P 500 data. The differences between my charts and the charts you are using to base your trading decisions from was significant. NetDania uses CFD data. I will use ESignals live charts from now onwards to prepare analysis for you.
This analysis should be of more use to you now. I thank you for your patience.
Main Wave Count.
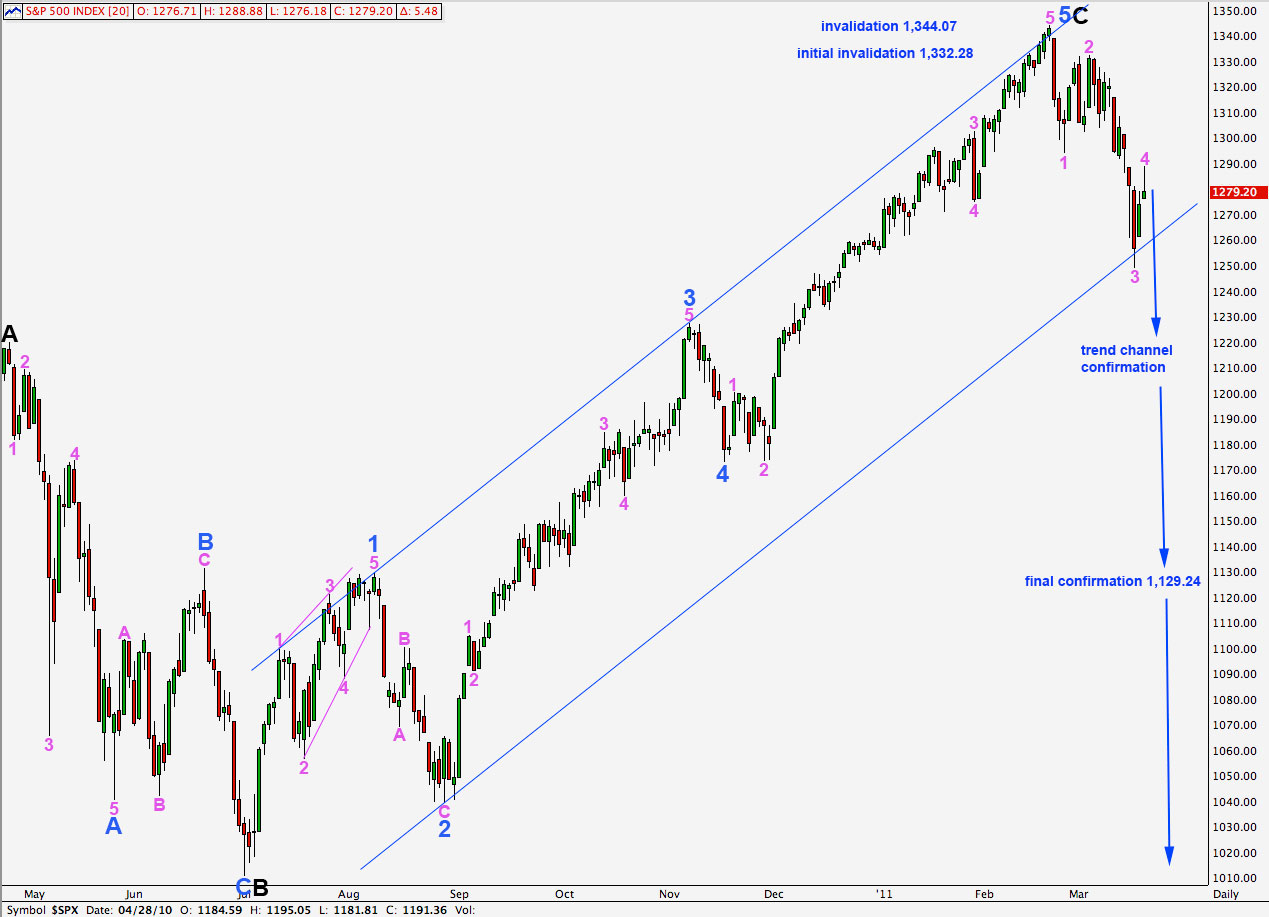
With the objection to a triangle as the sole structure within a second wave correction removed this wave count has the best fit visually. With this new data fibonacci ratios are not as good, but they are more than adequate.
It is most likely that we have an end to primary wave 2 zigzag and that primary wave 3 is underway.
The correction labeled here pink (minute) wave 2 cannot be part of a triangle; a contracting triangle may not have wave C move beyond the end of wave A and here it would do.
Wave C black is just 8.57 points short of 0.618 the length of wave A black.
Ratios within wave 3 blue are: wave 3 pink has no fibonacci ratio to wave 1 pink and wave 5 pink is 1.97 points longer than equality with wave 3 pink.
Ratios within wave 5 blue are: wave 3 pink is 13.43 points longer than 4.236 the length of wave 1 pink and wave 5 pink is 2.48 points short of 2.618 the length of wave 1 pink.
Strong movement below the wide blue parallel channel would provide a good indication that this wave count is correct. At that stage we may have confidence that primary wave 3 would be underway. Movement below 1,129.24 would provide final confirmation that primary wave 3 is underway.
Primary wave 3 must move beyond the end of primary wave 1, which is at 666.79.
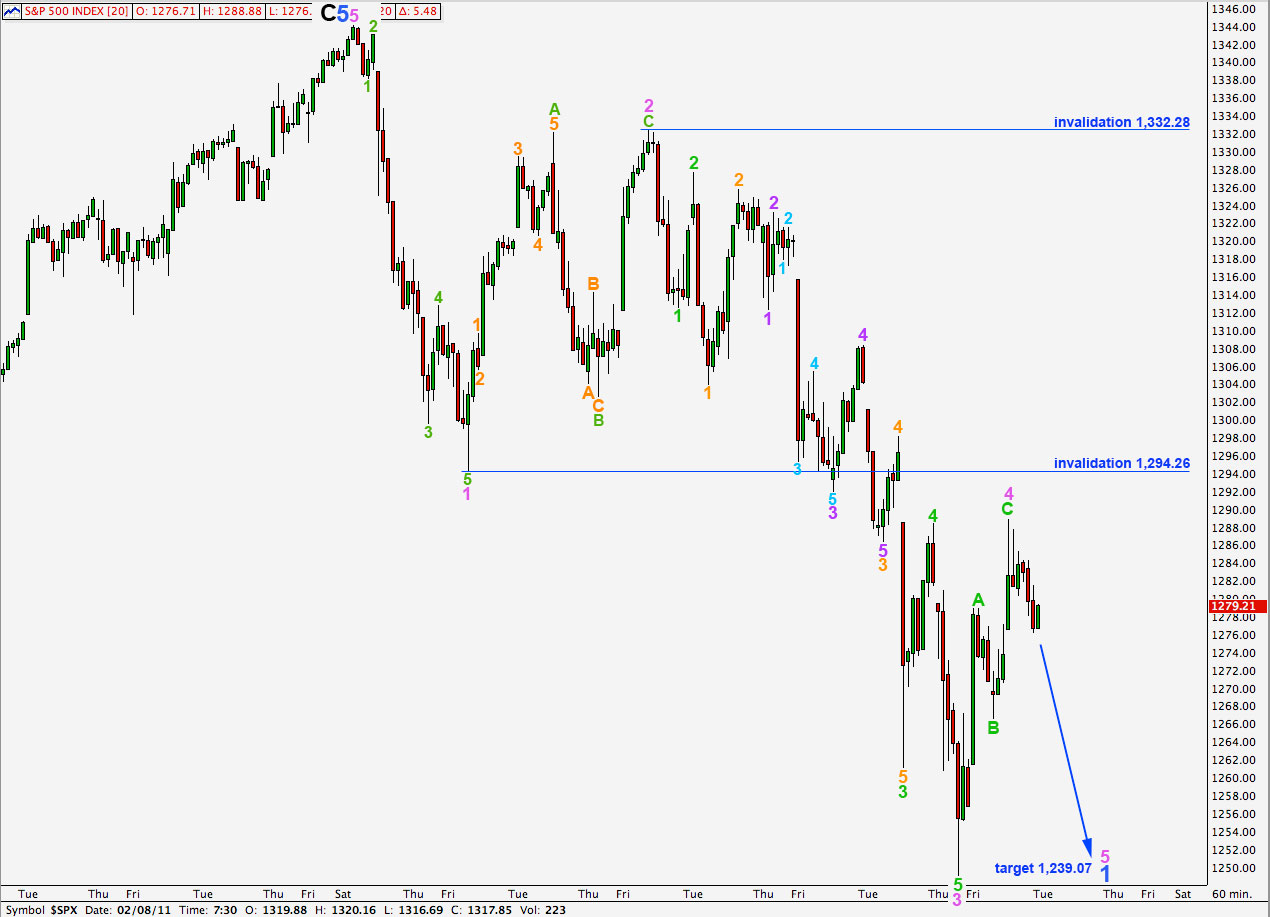
This hourly chart shows all of downward movement from the high at 1,344.07.
Wave 3 pink is most likely over. Wave 3 pink is just 2.64 points longer than 1.618 the length of wave 1 pink.
Ratios within wave 1 pink are: wave 3 green is just 2.68 points longer than 6.854 the length of wave 1 green and wave 5 green is just 1.95 points longer than 0.382 the length of wave 3 green.
Within wave 2 pink wave B green is a zigzag and wave C green ends slightly beyond the end of wave A green. There is no fibonacci ratio between waves A and C green, although wave C green is exactly 0.786 the length of wave A green.
Ratios within wave 3 pink are: wave 3 green has no fibonacci ratio to wave 1 green and wave 5 green is just 1.79 longer than 0.618 the length of wave 3 green.
Ratios within wave 3 green within wave 3 pink are: wave 3 orange is just 1.04 points longer than 1.618 the length of wave 1 orange and wave 5 orange is 2.31 short of equality with wave 3 orange.
Ratios within wave 3 orange are: wave 3 purple has no fibonacci ratio to wave 1 purple and wave 5 purple is just 0.19 points longer than 1.618 the length of wave 1 purple.
Ratios within wave 3 purple are: wave 3 aqua has no fibonacci ratio to wave 1 aqua and wave 5 aqua is just 0.56 points short of 2.618 the length of wave 1 aqua.
Wave 4 pink may not move into wave 1 pink price territory. Movement above 1,294.26 would invalidate this wave count.
If this wave count is invalidated by movement above 1,294.26 then we may move the degree of labeling within wave 3 pink down one degree; it would then be labeled as wave 1 green within wave 3 pink. Wave 2 green may not move beyond the start of wave 1 green. Movement above 1,332.28 would invalidate this wave count.
If this wave count is invalidated at this stage by movement above 1,332.28 then we should seriously consider the alternate wave count below.
Alternate Wave Count.
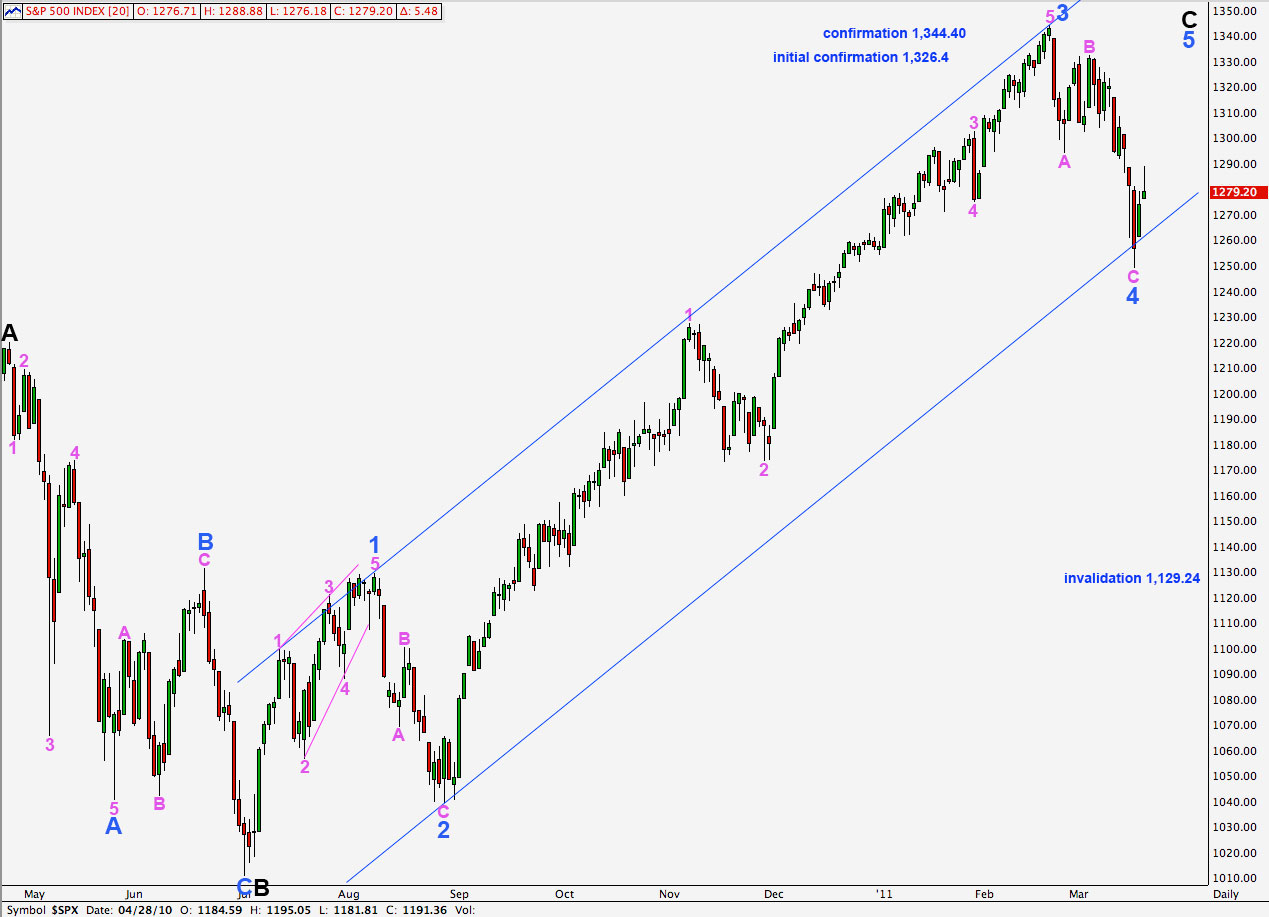
This wave count does not have a good a look on the daily chart as the main wave count. Wave 3 blue here has a strong three wave look.
There is no fibonacci ratio between waves 3 and 1 blue.
Ratios within wave 3 blue are: wave 3 pink has no fibonacci ratio to wave 1 pink and wave 5 pink is just 2.61 points short of 0.382 the length of wave 1 pink.
Significant movement below the wide blue parallel channel containing wave C black so far would indicate a trend change at intermediate and at primary degree.
Wave 4 blue may not move into wave 1 blue price territory. Movement below 1,129.24 would invalidate this wave count.
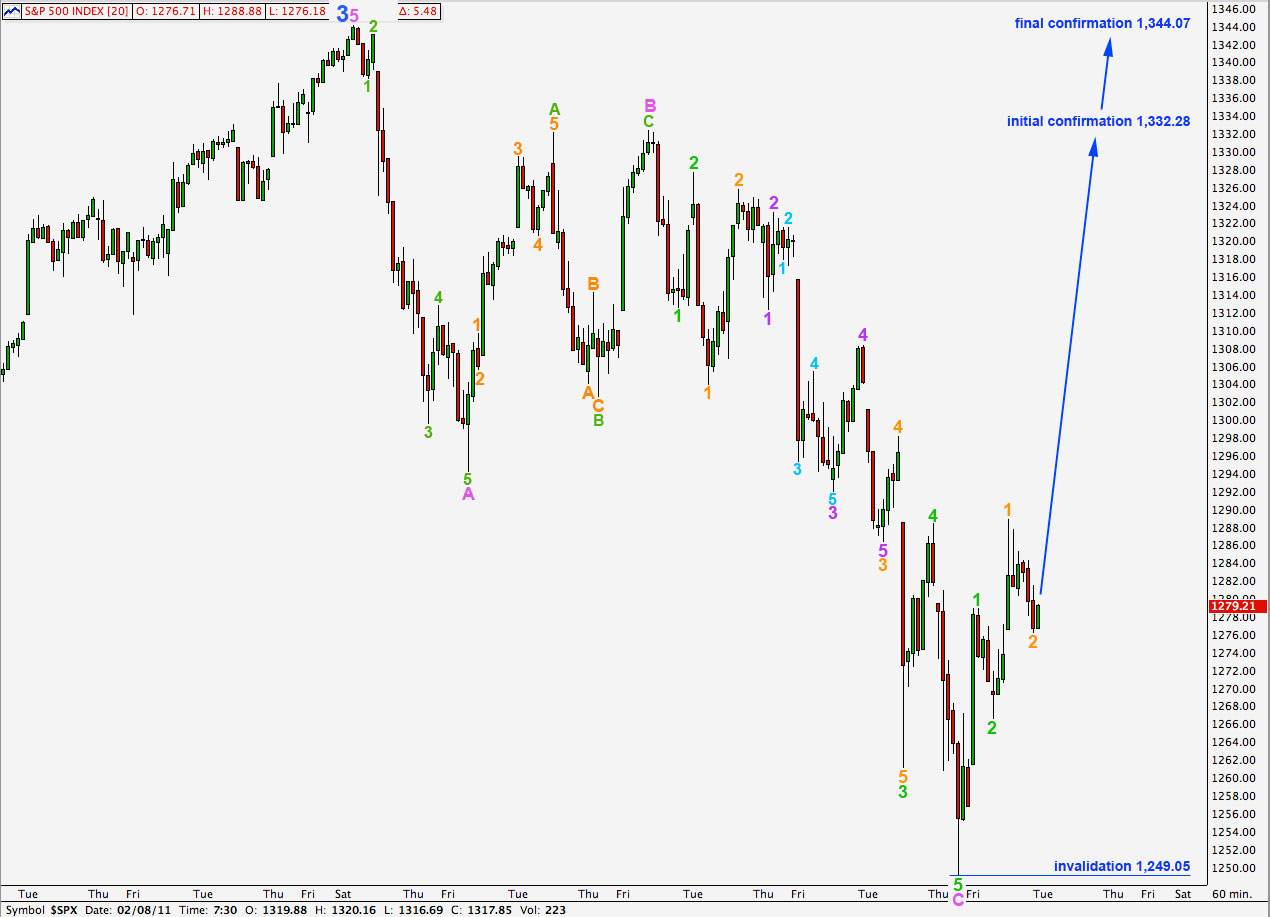
A-B-C and 1-2-3 look and behave essentially the same. The subdivisions and ratios within this wave count are the same as the main wave count on the hourly chart.
Any second wave correction since the end of wave 4 blue may not move beyond the start of the first. Movement below 1,249.05 would invalidate this wave count.
Movement above 1,332.28 would provide strong confirmation of this wave count while invalidating the main wave count. Movement above 1,344.07 would finally confirm this wave count. At that stage we may expect continuing upwards movement.
Lara,
This is a significantly different forecast. We are still somewhat in no-man´s land though!
Hi Alex,
Yes I know, some small differences in the data make an enormous difference to the wave count!
With no triangle but a nice zigzag in a second wave position the bearish wave count now has a better look.
We have to move the degree of labeling on the hourly chart from the start of pink 3 all down one degree now that 1,294.26 has been passed by this upwards wave.
It will be very interesting to see how this plays out…I just hope that the market will decide its direction very soon.
With the change in data and the count for the S&P, is your DOW analysis affected as well?
We would be interested in hearing a little more on how the change in data affected the wave counts too (i.e. what exactly changed in the data).
Thanks!
I have outlined the two most crucial differences in the data in todays video. I have explained how and why it changes the wave count.
I will still use NetDania data for US30, the Dow, that seems to be okay.
We are still at a point where we have two very different wave counts viable for the S&P today. If this is primary wave 3 down then the next downwards wave should clarify the situation. Once we have trend channel confirmation of a change we can expect that it is primary 3 underway.
After looking again at the Dow charts from the two sources I think that ESignal has cash data and NetDania probably has CFD data. So I’ll use ESignal.
It changes the wave count somewhat for the Dow.