
Elliott Wave chart analysis for the SPX500 for 18th March, 2011. Please click on the charts below to enlarge.
Upwards movement was higher than expected, invalidating the main hourly wave count. When wave C pink is viewed on a 1 or 2 hourly chart it has a strong 5 wave look. It may have been over as an ending expanding diagonal.
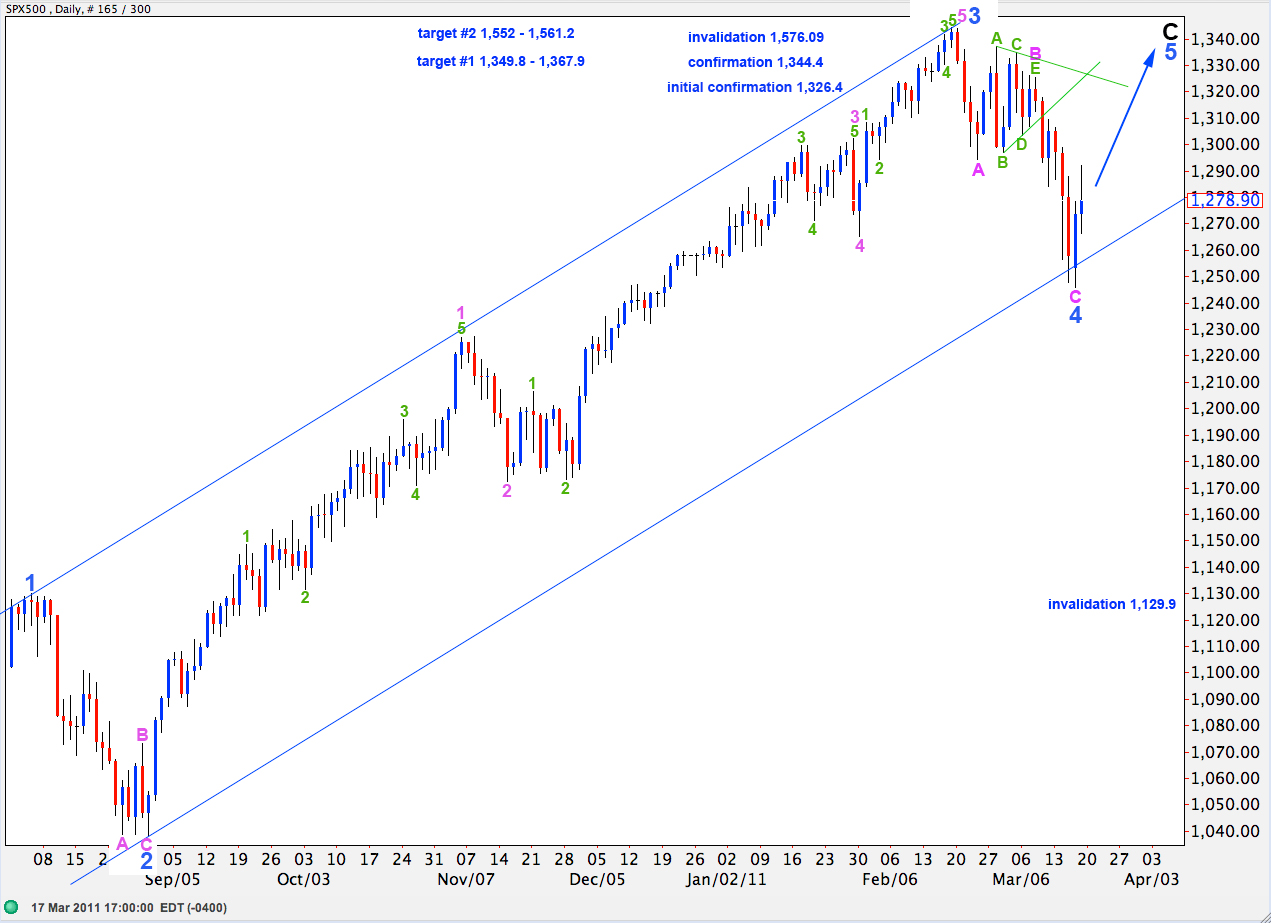
Movement above 1,326.4 would provide initial confirmation of this wave count.
Movement above 1,344.4 would fully confirm this wave count.
Within wave C black wave 3 blue is 13 points short of 2.618 the length of wave 1 blue. At 1,367.9 wave 5 blue will reach equality with wave 1 blue. At 1,349.8 wave C black will reach 0.618 the length of wave A black. This is our first target zone.
At 1,561.2 wave C black will reach equality with wave A black. At 1,552 wave 5 blue will reach equality with wave 3 blue. This is our second target zone.
Primary wave 2 may not move beyond the start of primary wave 1. This wave count is invalidated with movement above 1,576.09.
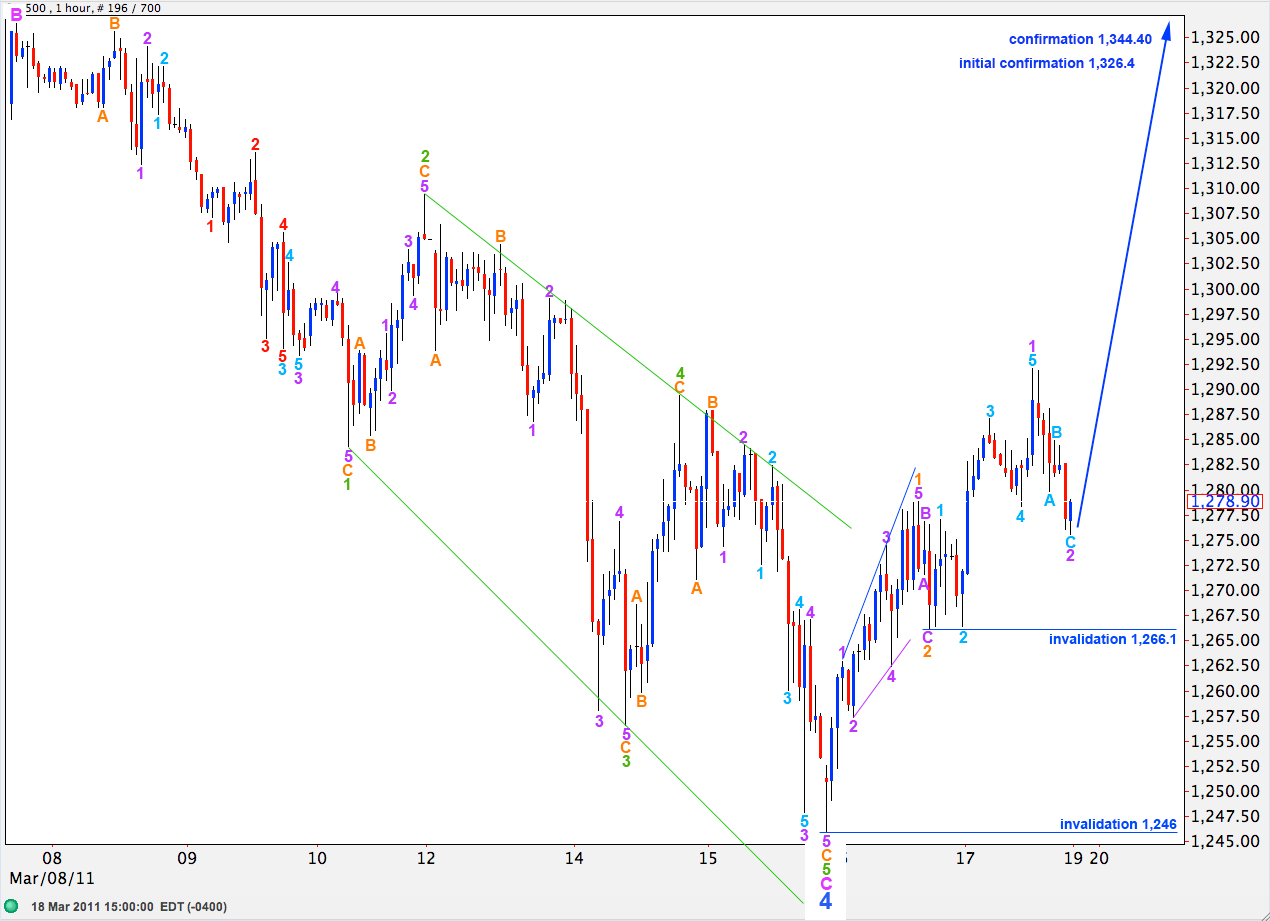
This hourly chart shows the whole of wave C pink from the end of the triangle at 1,326.4.
Wave C pink may have been an ending expanding diagonal. All subwaves can be seen as zigzags. This resolves the problem I had with the subdivisions of wave 5 green: the last third and fourth waves within wave C orange of 5 green are not now squashed up. This final downwards wave fits a zigzag structure particularly well.
Within wave 1 green there is no fibonacci ratio between waves A and C orange.
Ratios within wave C orange of wave 1 green zigzag are: wave 3 purple is 3.9 points short of 2.618 the length of wave 1 purple and wave 5 purple is 2.1 points longer than equality with wave 1 purple.
Within wave 2 green zigzag wave C orange is just 1.1 points short of 2.618 the length of wave A orange.
Ratios within wave C orange of wave 2 green are: wave 3 purple has no fibonacci ratio to wave 1 purple and wave 5 purple is just 0.2 points short of equality with wave 1 purple.
Within wave 3 green zigzag there is no fibonacci ratio between waves A and C orange.
Ratios within wave C orange of wave 3 green are: wave 3 purple has no fibonacci ratio to wave 1 purple and wave 5 purple is 2.7 points longer than equality with wave 1 purple.
Within wave 4 green zigzag wave C orange is 1.9 points longer than 2.618 the length of wave A orange.
Within wave 5 green zigzag wave C orange has no fibonacci ratio to wave A orange.
Ratios within wave C orange of wave 5 green are: wave 3 purple is 1.2 points longer than 2.618 the length of wave 1 purple and wave 5 purple is just 0.7 points short of 1.618 the length of wave 1 purple.
Upwards movement for wave 1 orange is most likely a leading expanding diagonal, with wave 3 as the longest.
Ratios within wave 1 purple upwards are: wave 3 aqua has no fibonacci ratio to wave 1 aqua and wave 5 aqua is 2.7 points longer than equality with wave 1 aqua.
Any further downwards extension of wave 2 purple may not move beyond the start of wave 1 purple below 1,266.1.
At this stage movement below 1,246 would invalidate this wave count. It would be very difficult to see downwards movement as a continuation of wave 4 blue at that stage.
Alternate Wave Count.
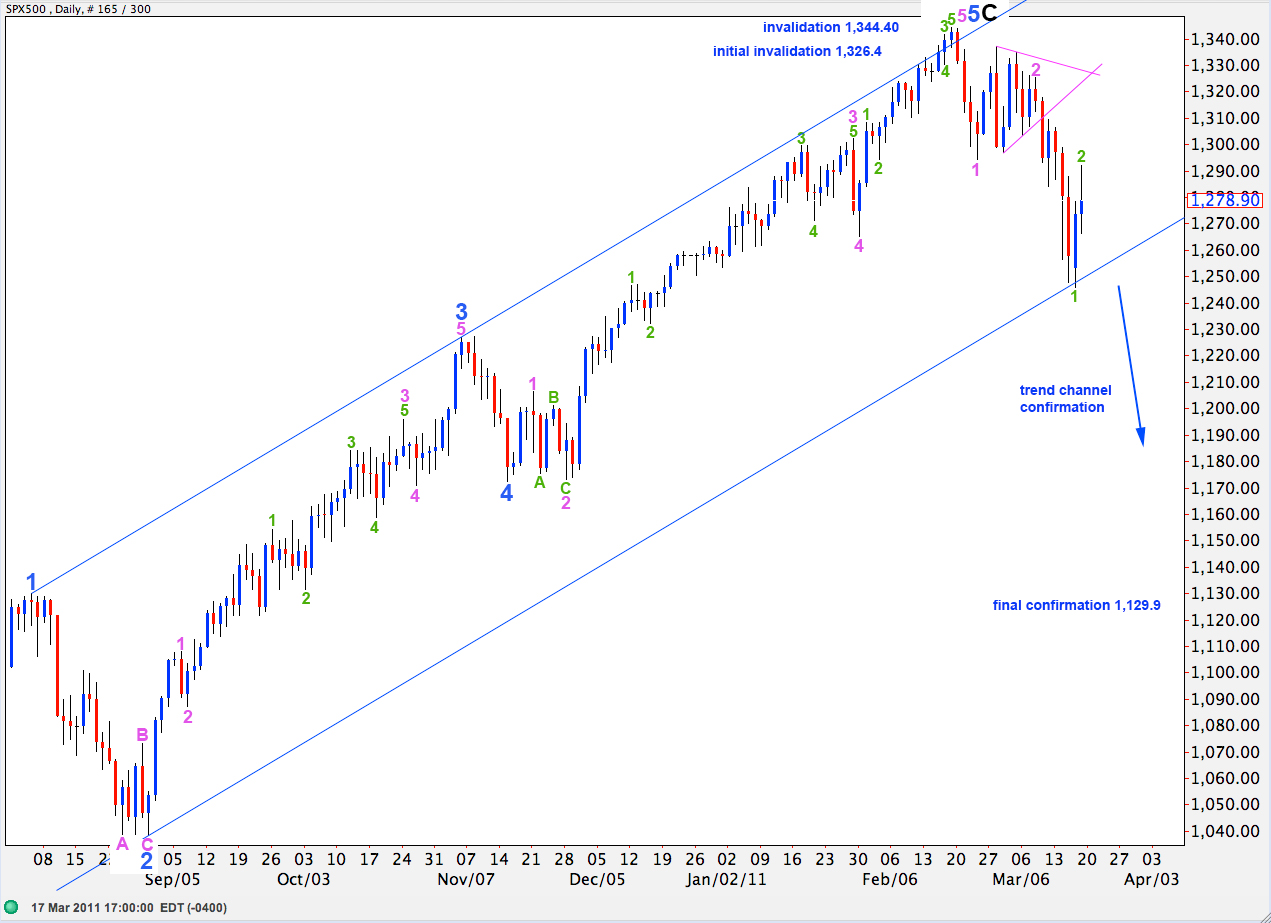
If this wave count is correct then wave 1 green was a leading expanding diagonal. Wave 2 green may not move beyond the start of wave 1 green. This wave count would be invalidated with movement above 1,326.4.
Any movement above 1,344 would finally invalidate this wave count. At that stage no alteration of labeling could see primary wave 3 as underway.
If this wave count is correct then the next downwards movement should be explosive as a third wave within a third wave within wave 1 blue downwards unfolds.
Movement below 1,246 would increase the probability that this wave count is correct. If we see movement below 1,246 in conjunction with wave behaviour fitting a strong third wave down then the probability that primary wave 3 is underway will increase significantly.
Hi Lara
I see you have not made an hourly alternative count – i.e. for the bearish case. Is it your intention only to do this if 1266 / 1246 support is broken?
Thanks
Hi Craig,
I did this eventually, but it took a whole day to find the right data and prepare both wave counts!