
Elliott Wave chart analysis for the SPX500 for 16th March, 2011. Please click on the charts below to enlarge.
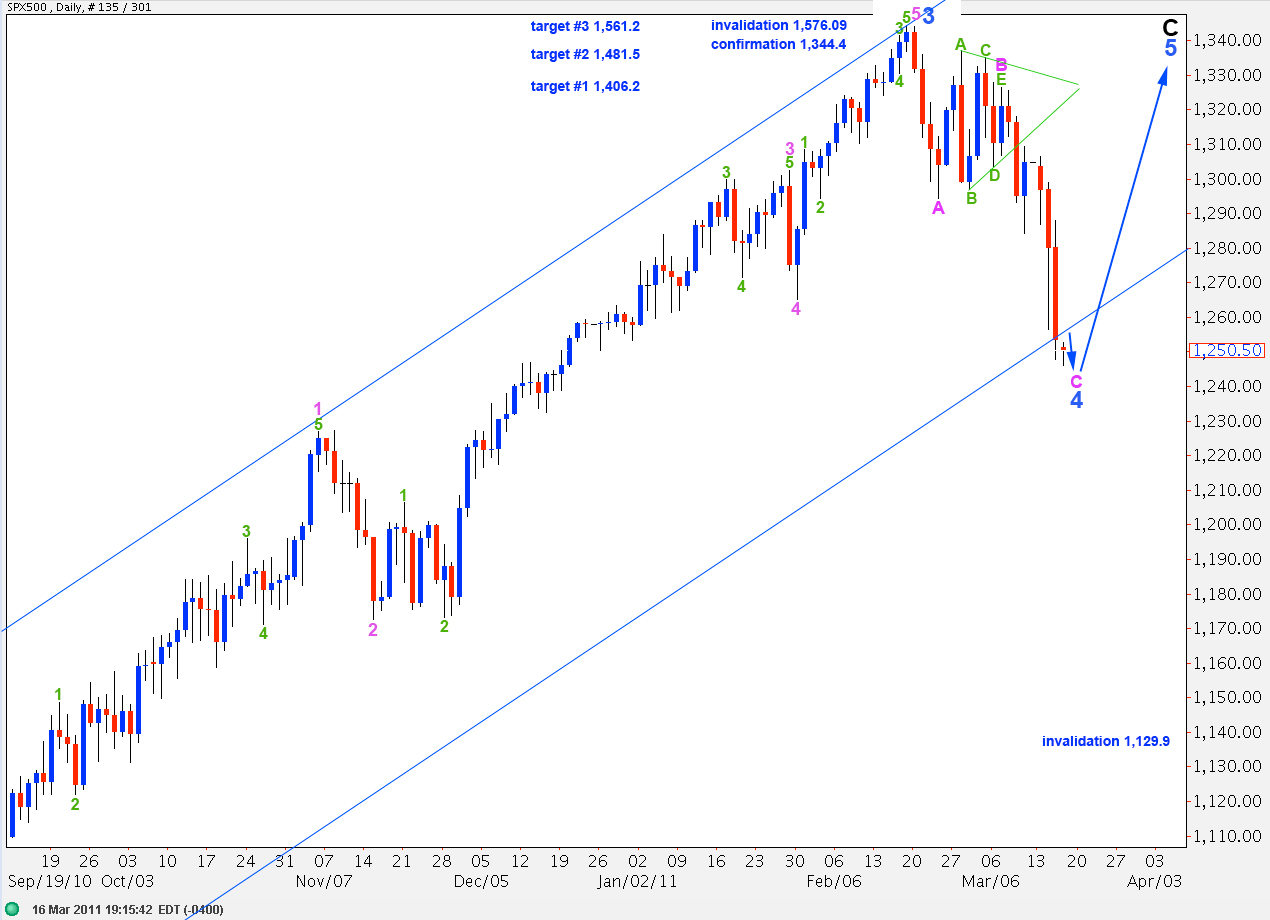
As expected the S&P has continued lower. We are close to the point where we should see a differentiation between this main wave count and the alternate possibility that we are within primary wave 3 down. Therefore, I will chart this possibility too for us.
Wave 4 blue may overshoot the wide blue parallel channel containing wave C black upwards. If, however, the overshoot develops too far as a strong channel breach then the possibility that primary wave 3 is underway will increase. We will have final confirmation of primary 3 when price moves below 1,129.9. At that stage we should expect the S&P to make new lows below 666.8.
We should keep drawing the triangle trend lines on the daily chart. In just one more day (and not on 22nd March as previously calculated) they will cross over. We may see a trend change at this point.
When wave C pink to end wave 4 blue is a satisfactory five wave impulse then we should be alert for a trend change. Movement above 1,325.6 would at that stage be required to confirm this bullish wave count and eliminate the alternate. However, if price does not move up that high and continues on lower then this wave count will be in serious doubt.
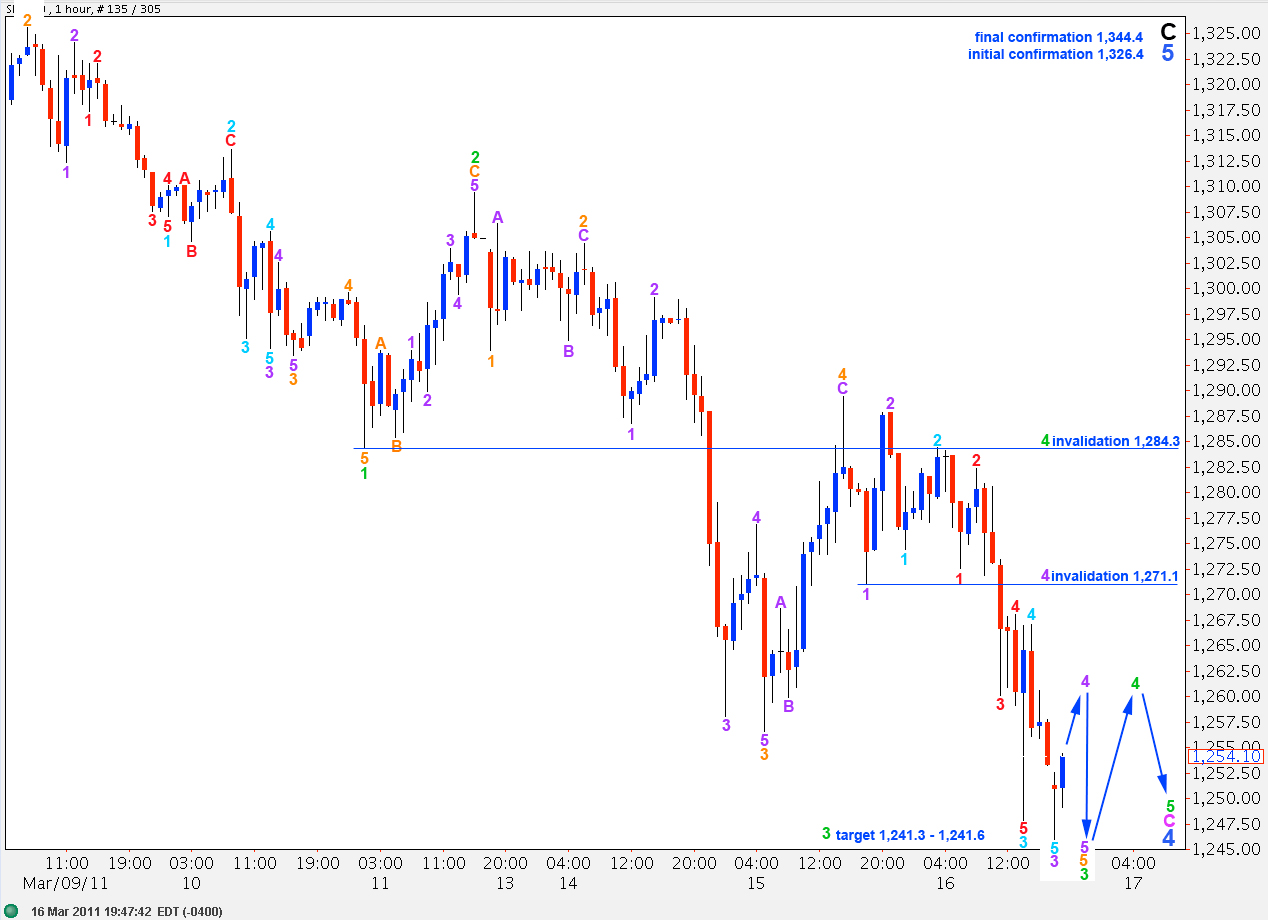
Downwards movement is developing as expected so far. We need to see a small fifth wave down to end wave 5 orange within wave 3 green.
Any further upwards movement of wave 4 purple may not move into wave 1 purple price territory above 1,280.4.
At 1,241.3 wave 3 green will reach 1.618 the length of wave 1 green.
Within green wave 3 there is no fibonacci ratio between waves 3 and 1 orange. Wave 5 orange will reach equality with wave 3 orange at 1,241.6.
1,241.3 to 1,241.6 is our target zone for green wave 3 to end.
Green wave 4 should thereafter develop upwards. It may not move into wave 1 green price territory above 1,284.3.
A final wave downwards for green wave 5 may be about 16 points to 26 points in length.
When we have a known length of wave 3 green and an end to wave 4 green I can more accurately calculate this final target for you.
This series of movements may take another day or so to complete. At that stage the S&P may be due for a trend change back upwards. That is the critical point between this main wave count and the alternate below.
Alternate Wave Count.
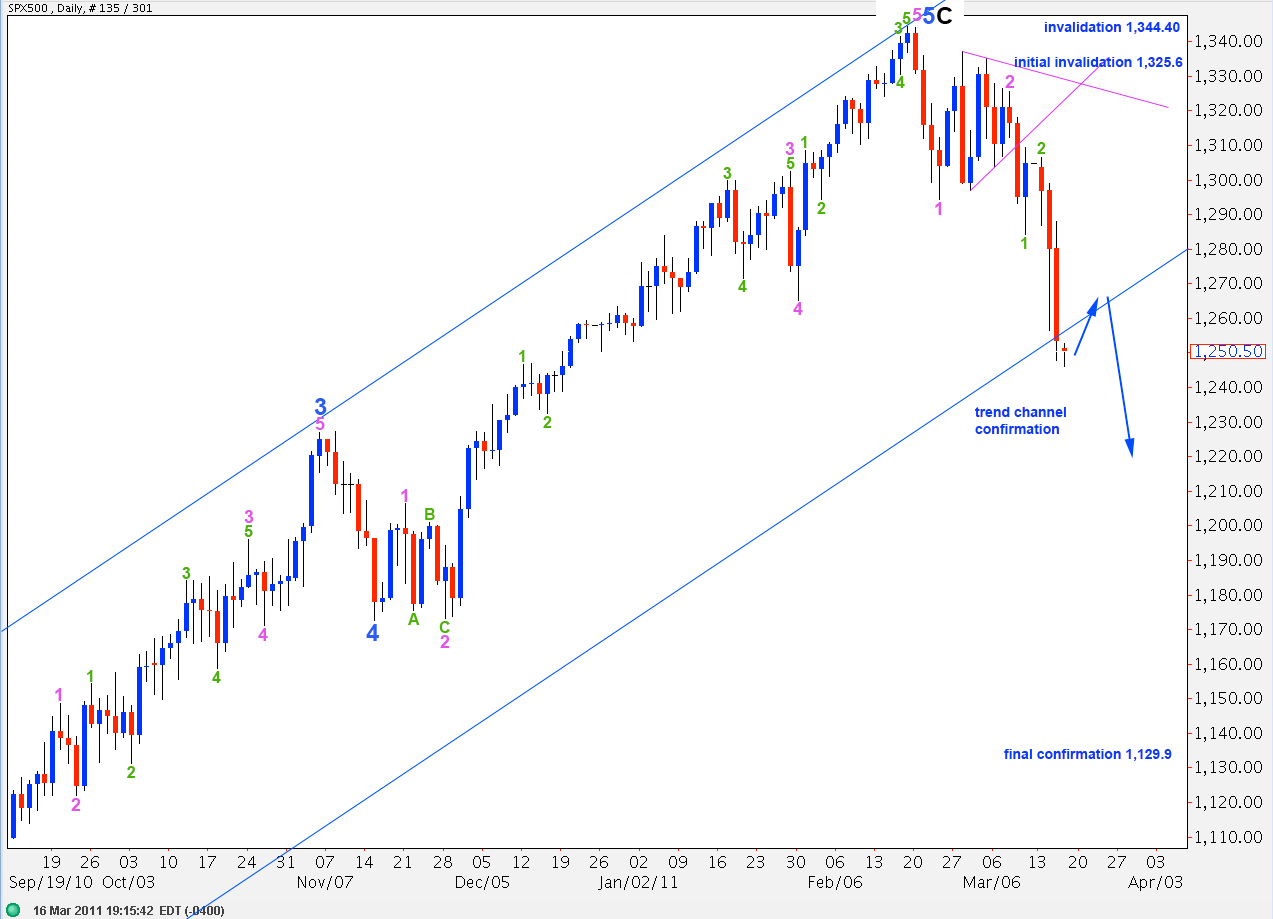
This wave count sees primary wave 2 zigzag as over and primary wave 3 underway.
I have continued to look for an alternate bearish wave count which does not see a triangle as the sole structure in a second wave position and I still cannot find an adequate one. This does not mean that it does not exist however!
At this stage this is the best fit for a bearish wave count that I can see. It has a very low probability simply because of the rarity of a triangle for a second wave.
Movement above 1,325.6, the end of the triangle, would put serious doubt on this wave count. Any second wave correction within wave 3 pink may not move beyond its start.
Lara,
Great work. Again, it’s awesome to see alternatives. Cant wait to see what unfolds.
Thanks,
John A
Me too!
I’m checking out the data feed I’m using. I may change it to another which more accurately reflects the market that members are trading.