
Elliott Wave chart analysis for the SPX500 for 14th March, 2011. Please click on the charts below to enlarge.
Downwards movement invalidated the hourly wave count. However, price has not made a new low and the main idea for the hourly wave count remains the same.
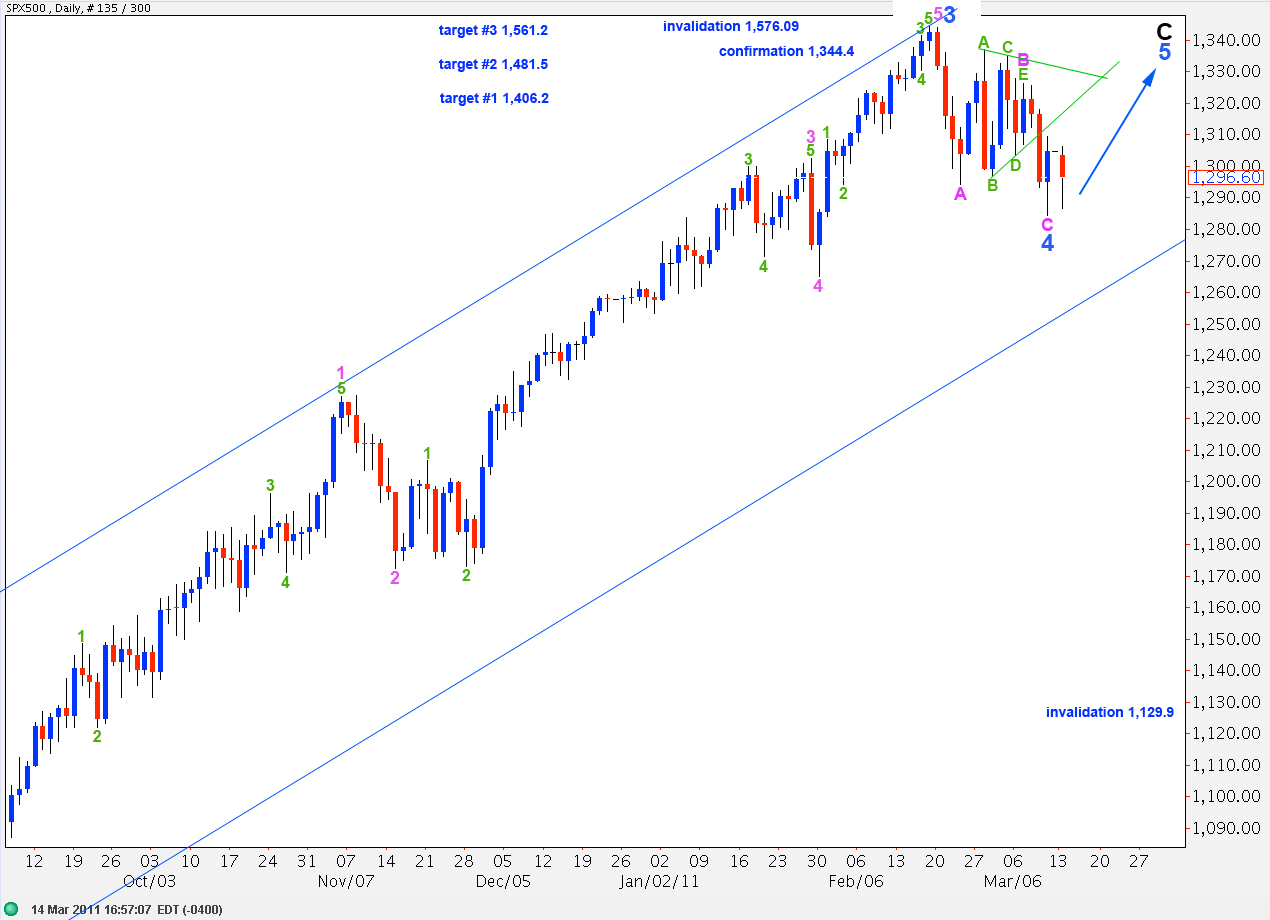
I have expanded the target range for wave 5 blue to end wave C black. About each of these points we will see if there is a satisfactory five wave structure upwards for wave 5 blue.
At 1,406.2 wave 5 blue will reach equality with wave 1 blue. At 1,481.5 wave 5 blue will reach 1.618 the length of wave 1 blue. At 1,561.2 wave C black will reach equality with wave A black.
At this stage we need movement above 1,326.4 to provide some confirmation of our wave count. At that stage the probability that upwards movement will continue towards new highs increases.
This wave count is invalidated with movement above 1,576.09.
Because waves D and E green of the triangle for wave B pink are both very strong three wave structures it is very difficult to see these as part of a new impulse downwards; wave D green would have to be seen as a five. So it is difficult to see the correction labeled B pink triangle as anything but a triangle.
It is possible that this triangle was a second wave and that we have seen a trend change at primary degree, although it is extremely rare for a triangle to be the sole corrective structure within a second wave. This possibility will be eliminated with price movement above 1,326.4.
Main Hourly Wave Count.
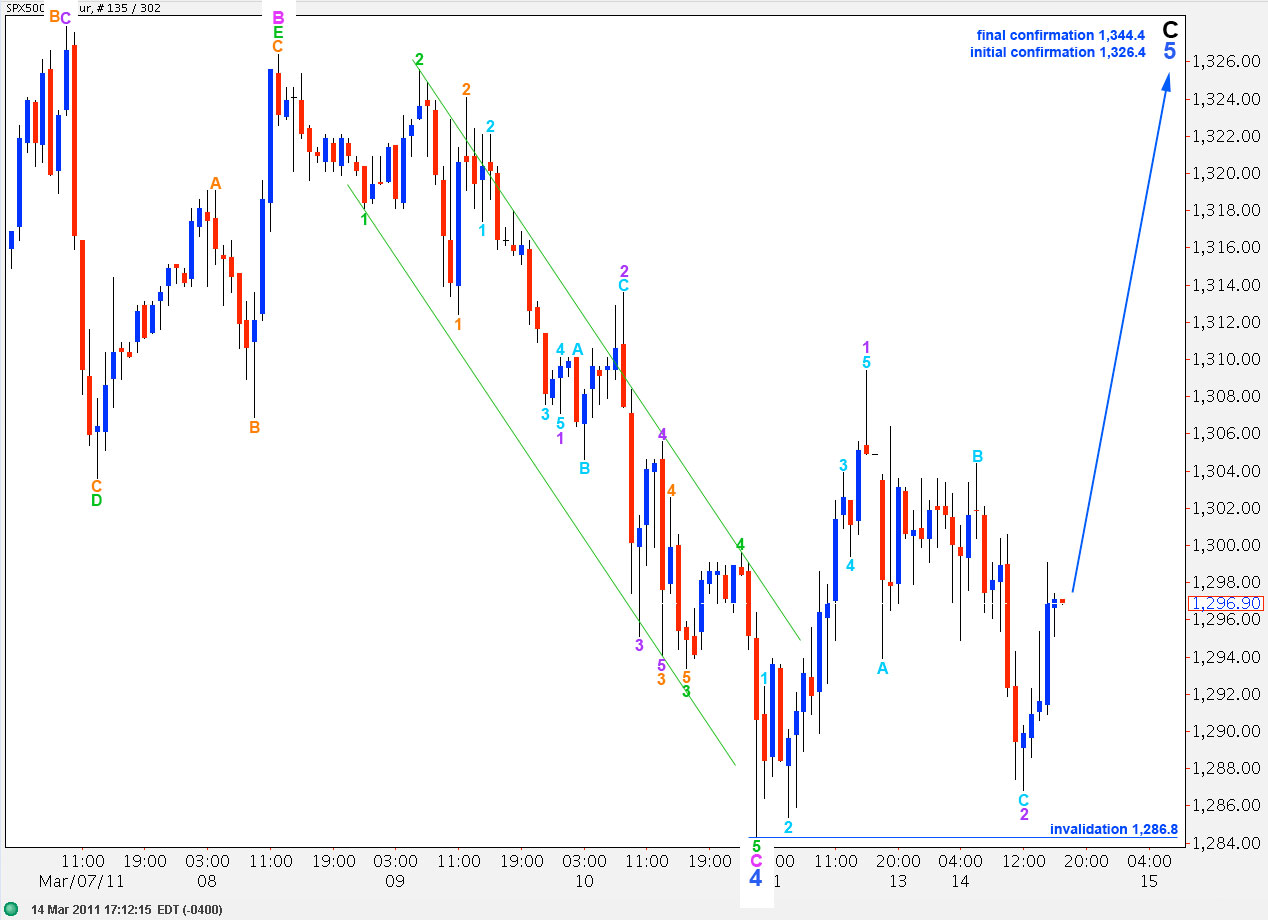
This main hourly wave count sees wave 4 blue as over.
Movement above 1,326.4 would provide confidence in this wave count. At that stage upwards movement may not be a second wave correction within wave 4 blue.
Ratios within wave 1 purple are: wave 3 aqua has no fibonacci ratio to wave 1 aqua and wave 5 aqua is 1.9 points longer than equality with wave 1 aqua.
This hourly wave count expects further upwards movement for the next session. Wave 3 purple must move beyond the end of wave 1 purple above 1,309.4.
Any further extension downwards of wave 2 purple may not move beyond the end of wave 1 purple. This wave count is invalidated with movement below 1,286.8.
Alternate Hourly Wave Count.
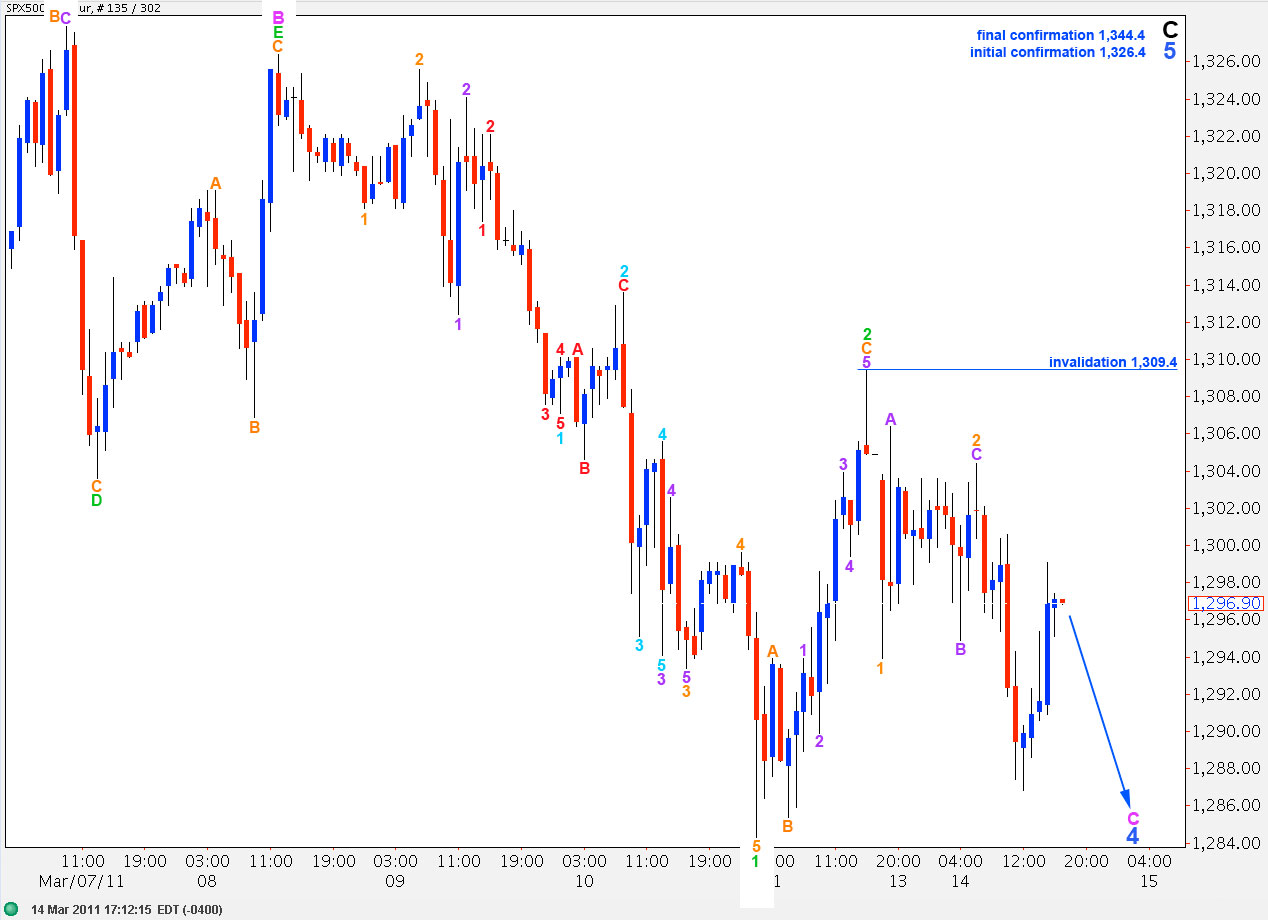
It is possible that downwards movement may have been only wave 1 green of wave C pink to end wave 4 blue zigzag.
Upwards movement labeled here 2 green certainly does have a strong three wave look.
Movement below 1,286.8 would invalidate the main hourly wave count and confirm this alternate.
At that stage we should expect further downwards movement to end an impulse for wave C pink of wave 4 blue.
Movement above 1,309.4 would invalidate this wave count as any second wave correction within wave 3 green may not move beyond the start of the first wave within it.
The long term outlook for both hourly wave counts is the same.
It’s amazing to see the Elliott Waves coincide with the events in Japan. I cant help but to be amazed.
John A
I know! And take a look at the dollar / yen on a daily chart. You would expect the earthquake and tsunami would force the yen to be devalued against the dollar and this chart should shoot up, but the triangle insists it should go down. I’ve kept an eye on this for the last few days and so far it’s behaving as expected. I expect it has further down to go. I’m looking for a good entry point for another short here today.
Looks like the alternative is in play. I’m still thinking a primary trend chang is also in play, but, too early to call.
Thanks Lara.
John A
Absolutely, and we will not know until we have a strong trend channel breach. There’s no reason though why that C wave to end wave 4 cannot be longer than A.
We’ve had calls for primary 3 thwarted so many times now, I’m wary of it. However, I’m trying to just stick to the rules and guidelines. That tells me there’s a triangle in there which must be a B wave so this downwards move should therefore be a correction.
Nikkei is crashing
Lara
What do make of the futures?
It’s either a continuation of 4 blue downwards, or it’s primary wave 3 and we saw an extremely rare triangle as the sole structure in a second wave. Those are the two options, I’m sorry I cannot be certain which is correct at this stage.
We will have to see a trend channel breach to confirm primary 3 at this stage.