
Elliott Wave chart analysis for the SPX500 for 11th March, 2011. Please click on the charts below to enlarge.

The S&P moved lower as expected during Friday’s session to end just 0.6 short of the target zone calculated. Wave 4 blue may have come to an unexpected speedy end. Thereafter, price has turned upwards in what is looking impulsive at this stage on the hourly chart.
We may have seen the beginning of a final fifth wave at minor degree to end primary wave 2 zigzag.
At 1,561.2 wave C black will reach equality with wave A black.
At 1,485.16 the minimum requirement for upwards movement for the alternate historical wave count will be met. At that stage it is technically possible that we may even see new all time highs for the S&P before it turns downwards to make new lows.
For this wave count primary wave 2 may not move beyond the start of primary wave 1. This wave count is invalidated with movement above 1,576.09.
It is possible that the triangle could be a second wave correction for the start of primary wave 3 down. However, the extreme rarity of a triangle being the sole corrective structure within a second wave means that we need to be aware of this as an outlying possibility, but no more. This will be invalidated if price moves above 1,326.4.
It is not possible for a triangle to be the first structure in a double combination correction. This correction, whatever it is labeled, is therefore over.
As expected price continued downwards, although wave C pink may have come to a much quicker end than we were expecting.
Wave C pink within wave 4 blue has no fibonacci ratio or relationship of equality to wave A pink.
Ratios within wave C pink are: wave 3 green is 3 points longer than 4.236 the length of wave 1 green and wave 5 green is 1.9 points longer than 1.618 the length of wave 1 green.
Within upwards movement wave 3 purple is 1.1 points short of 2.618 the length of wave 1 purple.
Ratios within wave 3 purple are: wave 3 aqua has no fibonacci ratio to wave 1 aqua and wave 5 aqua is just 0.2 points short of equality with wave 1 aqua.
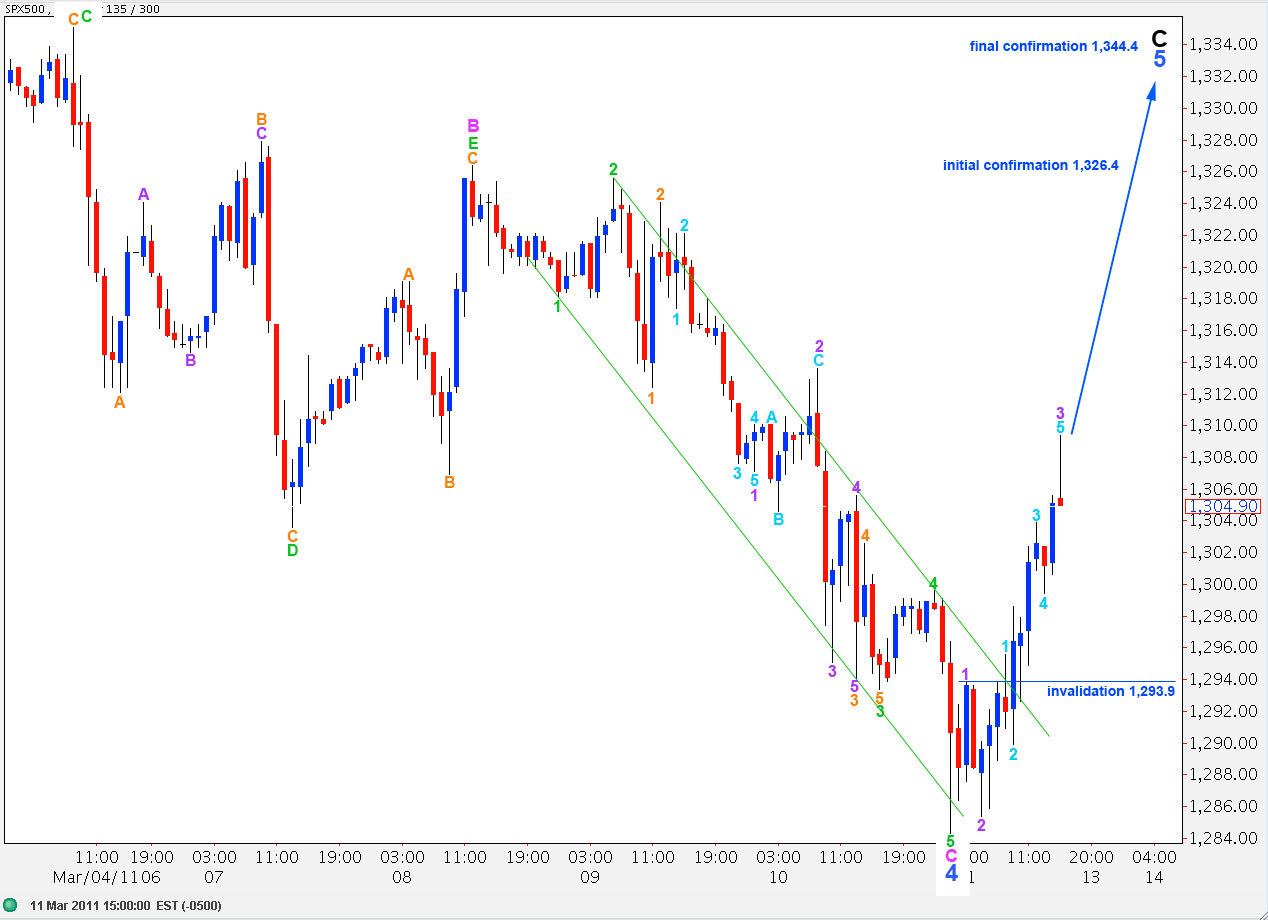
Wave 4 purple may not move into wave 1 purple price territory. This wave count is invalidated with movement below 1,293.9.
When we see price move above 1,326.4 we may eliminate the possibility that the triangle was a minute second wave correction within a new downwards trend, because any second wave correction within a third wave down may not move beyond the start of the first wave, and this is the point at which the triangle structure ends and a third wave would have begun.
Movement above 1,344.4 will provide full and final confirmation that the S&P is in a fifth wave upwards.
The SAP has now hit your inval point of 1293. What now….
I suspect my labeling of the recent movement is incorrect. We have probably seen a first wave up and this may be its counterpart second wave down. If it moves below 1,294.1 however then the alternate would be to reduce the degree of labeling for C pink all down one degree. That would start to look like a long C wave though.
Lara– As usual, thanks for the thorough analysis. Why is the dow projected to top at a .618 C to A while the S&P is projected at 1.00 C to A? Wouldn’t they both be the same at 1352 and 12519?
It does not seem like a very sizeable fifth wave for the S&P. It’s only a further rise of 7.6 points from the last high.
When we have more of this upwards movement to analyse I can try to get a more accurate target for you. There will be several targets also based upon fibonacci ratios at blue degree. Black degree may not manage an adequate ratio.