
Elliott Wave chart analysis for the SPX500 for 10th March, 2011. Please click on the charts below to enlarge.
This is our sole remaining wave count after the end of sideways movement. It is not the only technically correct possibility, but it is the only wave count which I can see at this stage which allows for a triangle.
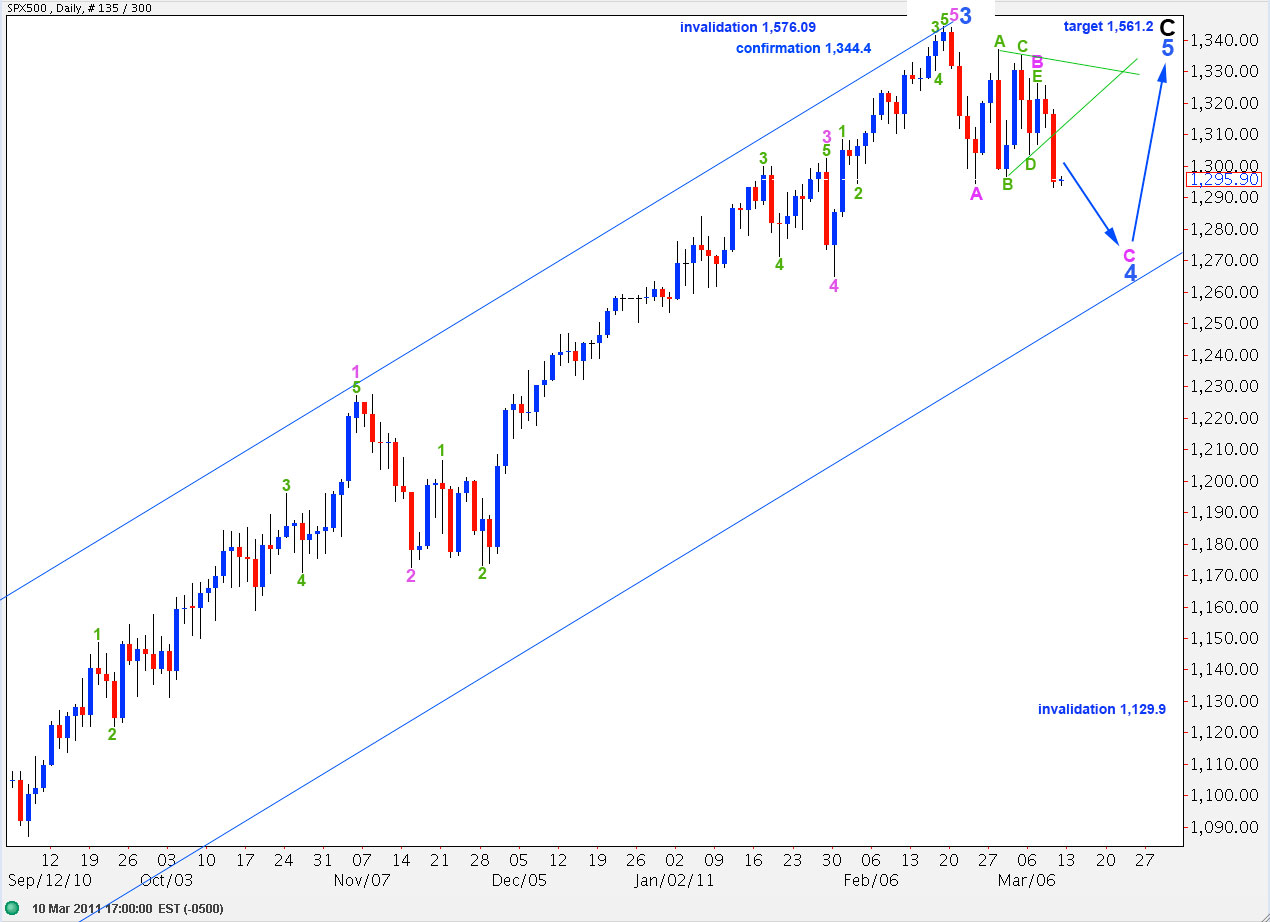
We have most likely not seen the end of wave 4 blue. Wave C pink is yet to have a complete impulsive wave count.
We should keep drawing the triangle trend lines on the daily chart. When these trend lines cross over, at that point in time we may see the end of wave 4 blue and the start of wave 5 blue. This is a few days away on the 22nd of March.
On the 18th of March this fourth wave will have lasted a fibonacci 21 days, it may end there.
We should keep drawing a trend channel around wave C black. We may expect wave 4 blue to come to end about the lower end of this wide blue parallel channel.
Wave 4 blue may not move into wave 1 blue price territory therefore this wave count is invalidated with movement below 1,272.1.
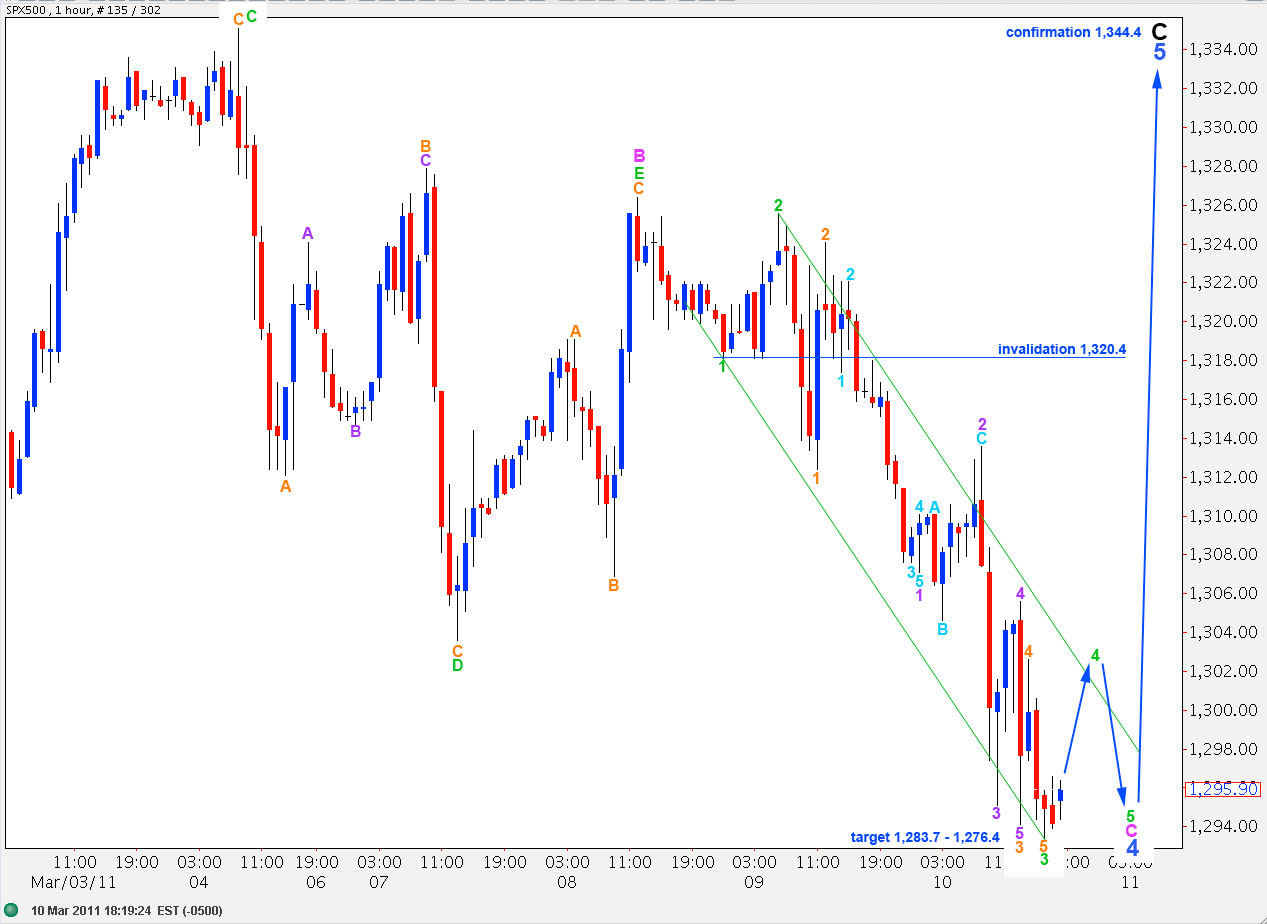
The triangle most likely ended at 1,326.4, with wave E green as a simple zigzag. Wave E green is 3.3 points longer than 0.618 the length of wave D green. This is the closest 0.618 ratio within the five subwaves of this triangle.
Wave C pink downwards is likely to last a few more days. We may need to move the degree of labeling within it down one degree, we will see how it unfolds.
Wave 3 green is exactly 4.236 the length of wave 1 green.
Ratios within wave 3 green are: wave 3 orange has no fibonacci ratio to wave 1 orange, and wave 5 orange is just 1 point longer than 0.618 the length of wave 1 orange.
Ratios within wave 3 orange are: wave 3 purple is 1.5 points longer than equality with wave 1 purple, and wave 5 purple is just 0.8 points longer than 0.618 the length of wave 3 purple.
Wave 4 green upwards may not move into wave 1 green price territory. This wave count is invalidated with movement above 1,320.4.
Wave 4 green is likely to end about the upper edge of the small green parallel channel drawn here. Thereafter wave 5 green is likely to be extended, if this degree of labeling is correct.
The target zone of 1,283.7 to 1,276.4 is for wave C pink to end.
At 1,283.7 wave C pink will equal the widest part of the triangle in length.
At 1,276.4 wave C pink will reach equality with wave A pink.
since i’ve been away, you’ve probably covered this and i missed it, but why can’t the triangle be wave 2 of minor wave 1 of primary wave 3 down?
what am i missing here?
Hey Robert, welcome back! You’re right, the triangle could be minute wave 2. It is possible to have a triangle as the sole corrective structure, but it is extremely rare. Triangles normally form prior to the final actionary wave and third waves are not the final actionary wave in a sequence. So this is certainly a valid alternate idea. If upwards movement fails to move above 1,326.4 then this will be possible.