
Elliott Wave chart analysis for the SPX500 for 7th March, 2011. Please click on the charts below to enlarge.
As expected for this wave count (and also in the short term for the alternate) we have seen some more downward movement from the S&P. Again, it has failed to make a new low and both of our wave counts remain valid. At this stage the triangle alternate is looking even better.
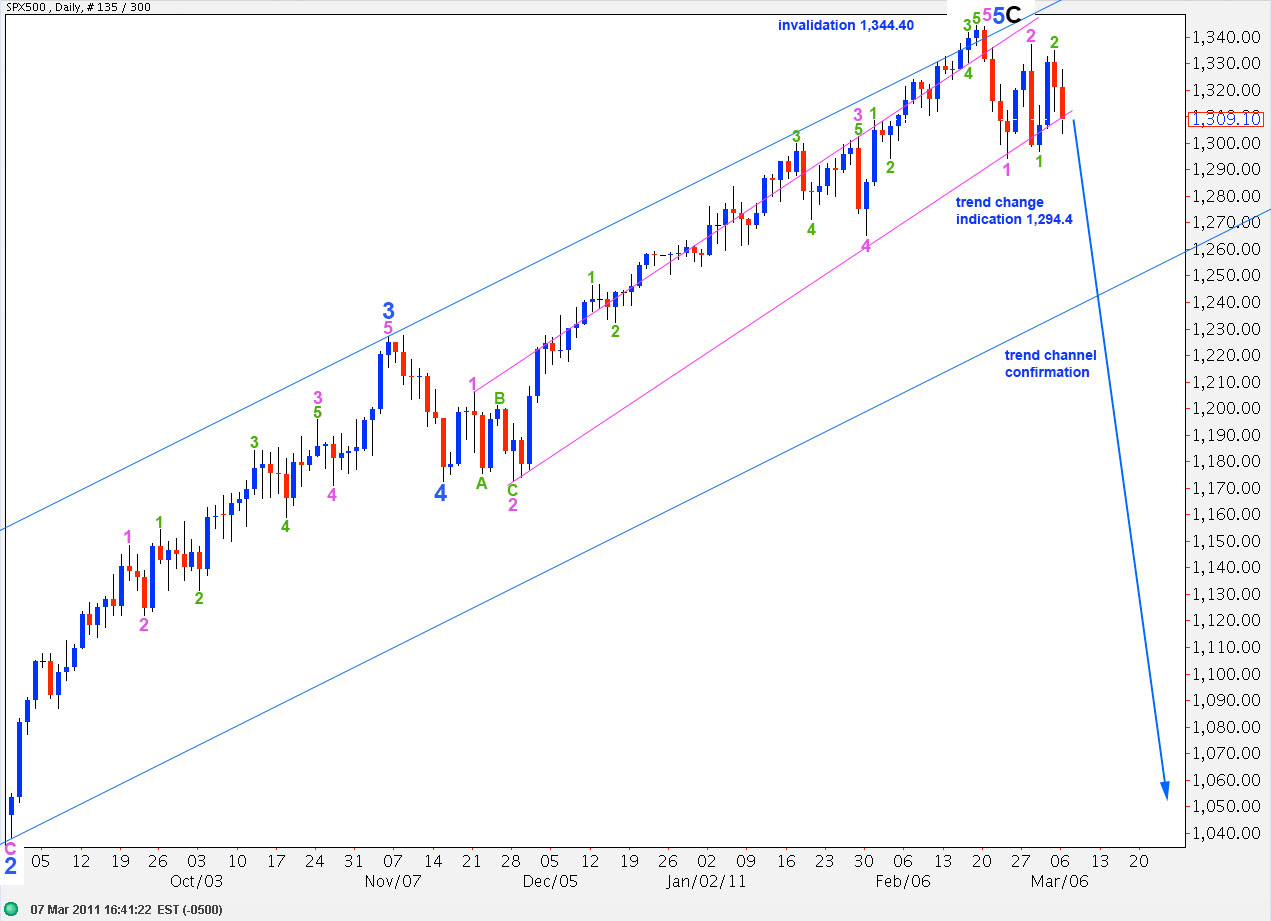
The trend change to the downside is unconfirmed. We need to see movement below 1,294.4 initially to provide confidence in this wave count.
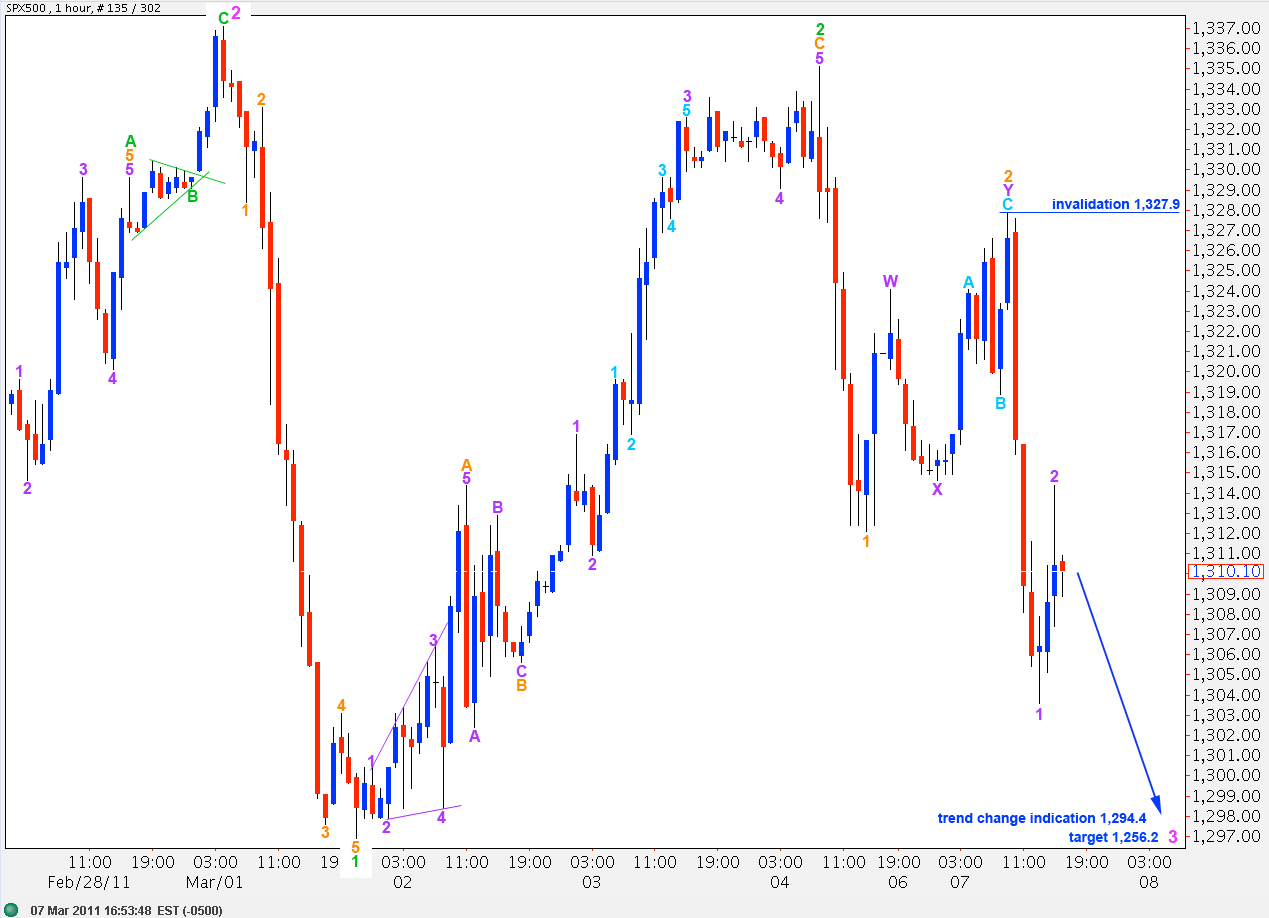
We should also see movement below the smaller pink parallel channel to provide additional confidence that we have seen a trend change.
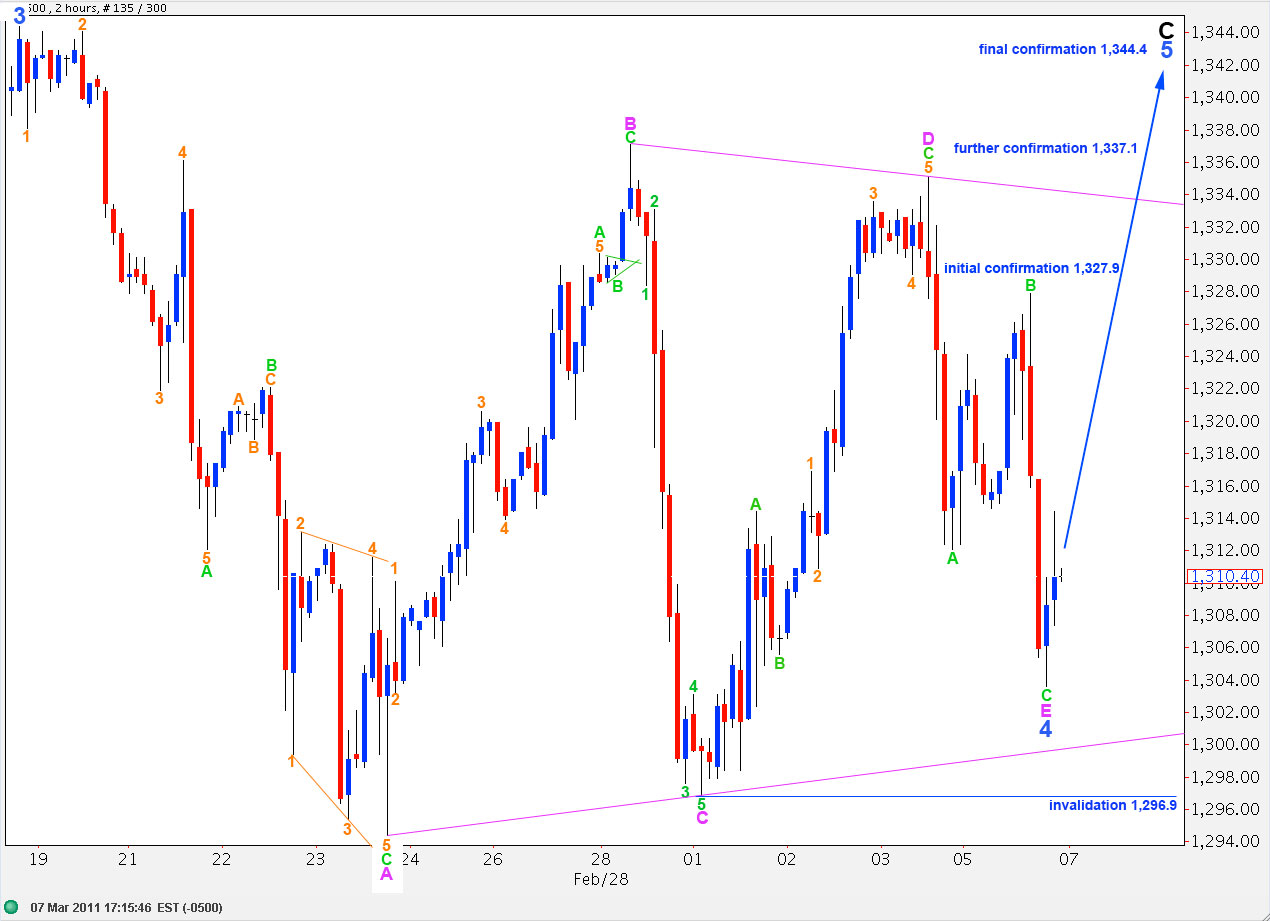
At this stage movement above 1,337.1 would invalidate this wave count and confirm our alternate.
Movement above 1,344.4 to a new high would firmly invalidate this wave count. At that stage we should expect quite a lot more upward movement.
Because 1-2-3 looks and behaves essentially the same as A-B-C we need to see movement below the blue parallel channel here on the daily chart to finally confirm a trend change at primary degree. At this stage, with so many alternate possibilities, movement below 1,265.1 will no longer provide the confirmation we seek.
This wave count sees downward movement as a series of overlapping first and second waves; the second waves are all deep corrections.
If this wave count is correct then we may see explosive downward movement next. When first and second waves overlap in a series such as this it is like a wound up spring with potential kinetic energy. The third wave down would release all this energy in explosive downward movement.
Wave 2 purple may not move above the start of wave 1 purple. Therefore, movement above 1,327.9 would invalidate this hourly wave count and put considerable doubt on a trend change.
There is another possibility that I can see: price may continue to move sideways to form a triangle beginning at the high labeled here 2 pink, for a B wave at green degree. Thereafter, a C wave upward may form a double top. If this alternate scenario shows itself in the next couple of days I shall chart it for you. At this stage such a triangle may not move above 1,335.1. or below 1,296.9 and it still needs waves D and E to complete it, which would take at least another 2 days or so.
Alternate Wave Count.
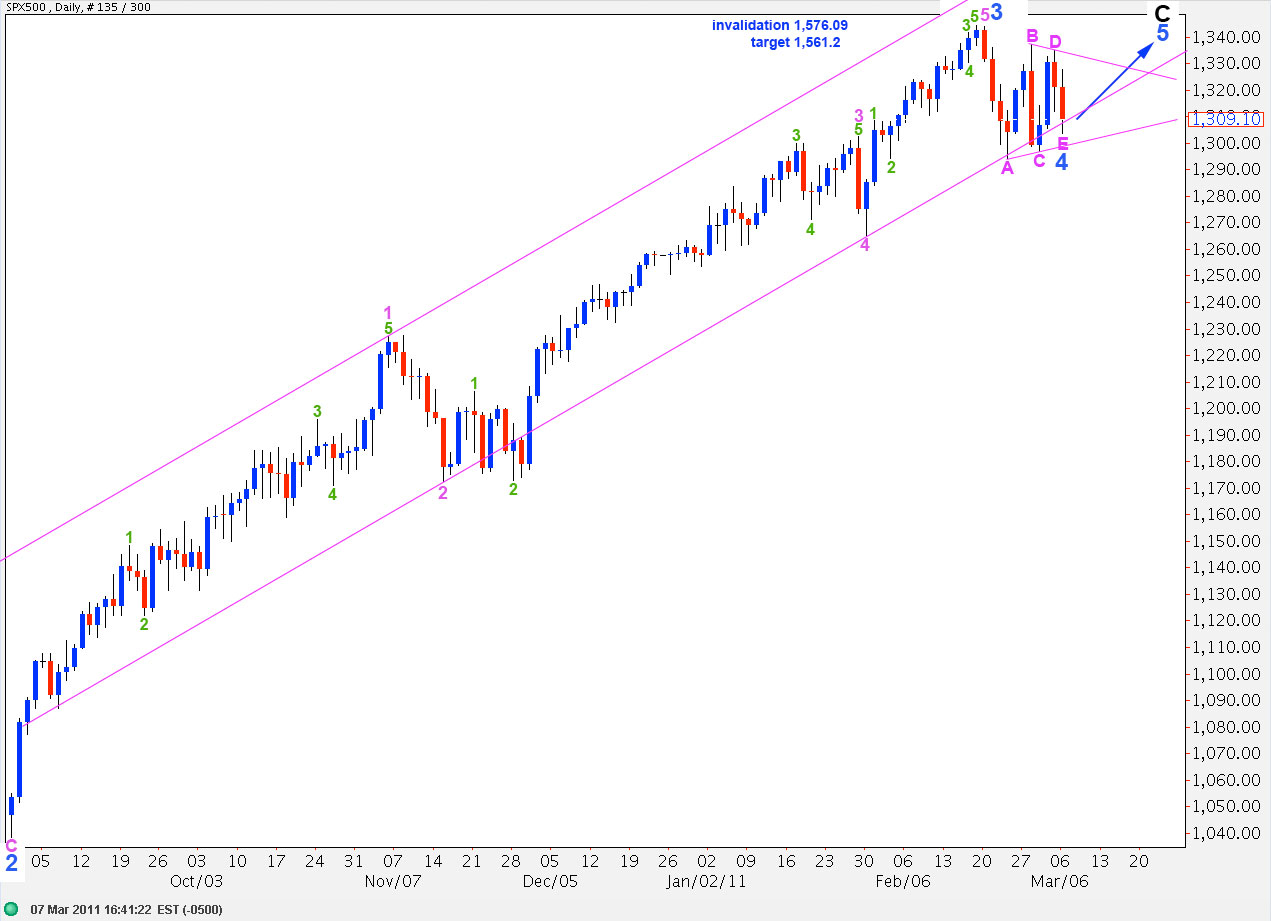
This alternate wave count remains valid. The triangle now has a nice looking E wave which may have just been over at the end of Monday’s session.
If this wave count is correct then we should see movement above 1,335.1 to initially confirm it.
If this wave count is correct then a target for wave 5 blue to end is at 1,561.2 where wave C black will reach equality with wave A black.
Thank you Lara. It’s real impressive to see so many options. Looks like we should wait to see.
John A