
Elliott Wave chart analysis for the SPX500 for 2nd March, 2011. Please click on the charts below to enlarge.
The S&P behaved mostly as expected yesterday, moving downward to end 0.7 short of the target calculated then moving upward in choppy overlapping corrective movement.
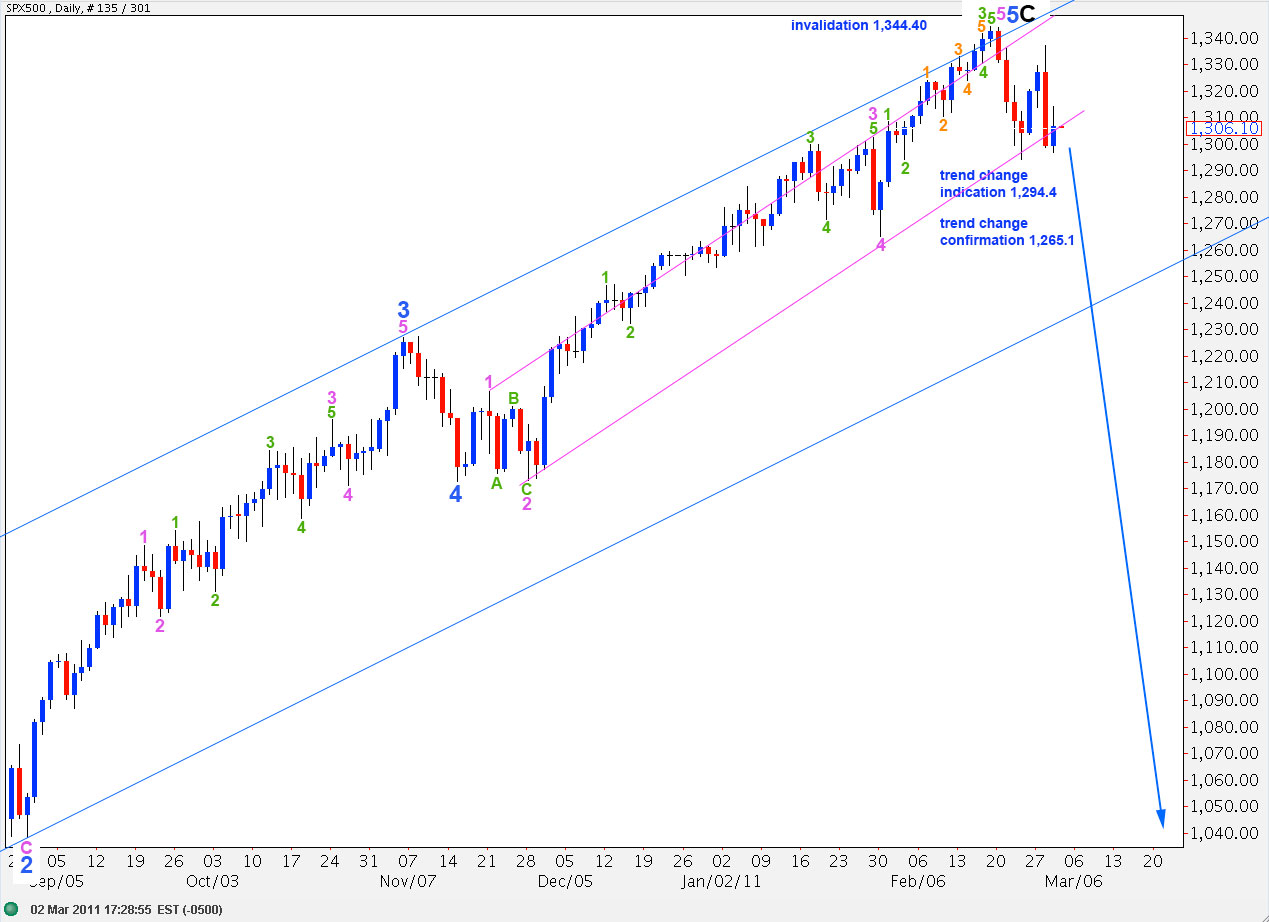
When this correction is over the strong downward movement should resume.
The trend change is looking more likely. Movement below the trend channel containing wave 5 blue (pink lines) will provide an indication of a trend change. Movement below 1,265.1 may be considered confirmation of a trend change.
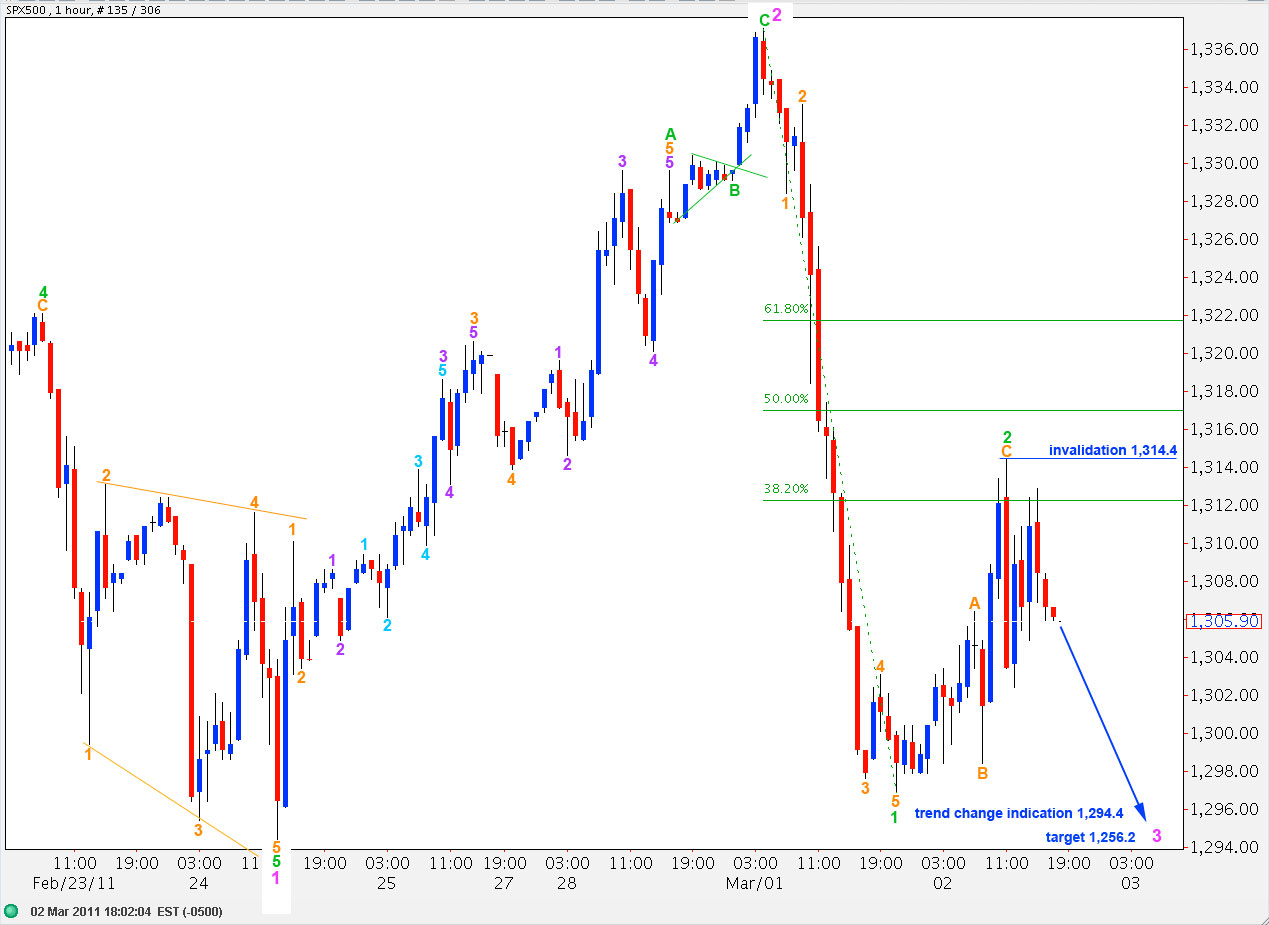
We have another clear five wave structure downward complete on the hourly chart now.
Ratios within wave 1 green are: wave 4 orange is just 1.4 points short of 4.236 the length of wave 1 orange and there is no fibonacci ratio between wave 5 orange and either 1 or 3.
Within wave 2 green wave C orange is just 0.6 points longer than 1.618 the length of wave A orange. Wave 2 green may have been over here, and it is most likely that it was. The most likely next direction for the S&P should be strong downward movement in a third wave at green degree of a third wave at pink degree.
Any second wave correction within wave 3 green may not move beyond the start of the first. Therefore, this wave count is invalidated with movement above 1,314.4.
In the first instance we may expect this next strong wave down to take price to about 1,274.2 where wave 3 green will reach equality with wave 1 green.
Thereafter, a fourth wave correction may not move above 1,296.9.
However, although wave 2 green is labeled here as complete we must also consider the possibility that only wave A of wave 2 green is complete. This alternate is charted below.
Alternate Hourly Wave Count.
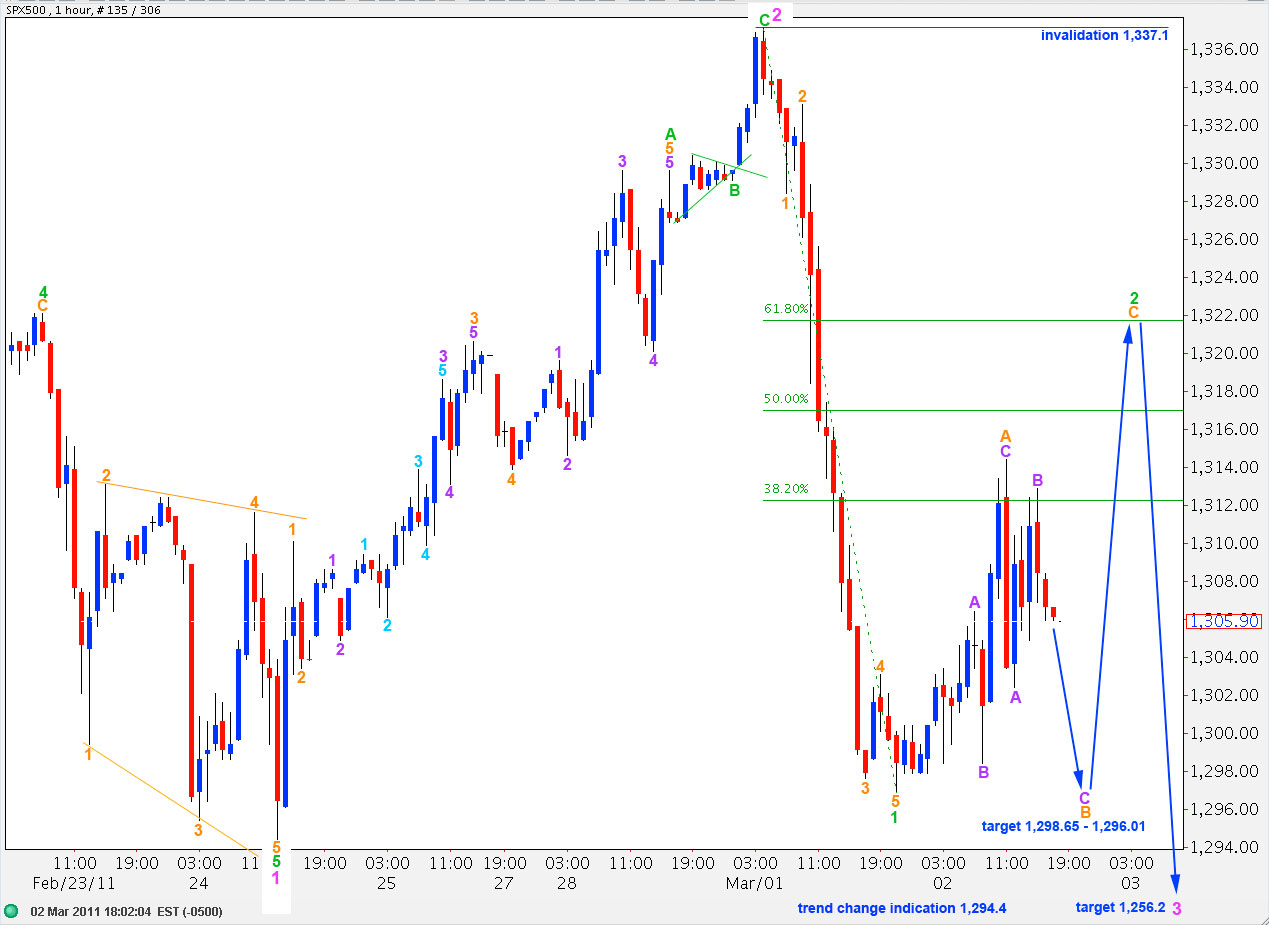
Wave 2 green may be unfolding as a flat correction with wave A orange a three wave structure.
Wave B of a flat must reach at least 90% the length of wave A. This is achieved at 1,298.65.
The most common type of flat is an expanded flat which requires wave B to be at least 105% the length of wave A. This is achieved at 1,296.01.
If downward movement ends about this target zone and it looks corrective and subdivides into a three wave structure, then it is likely to be a B wave and we should then expect wave C to take price above 1,314.4 (highly likely).
Wave 2 green may not move beyond the start of wave 1 green. Therefore, this wave count is invalidated with movement above 1,337.10.
Yes, this second wave is looking more how you had originally thought it could tern out. If your primary wave count is correct then there are allot of people that are going to get caught by surprise, all you hear from the financial advisers is that we are going higher from here.
Lara, thanks for the fast response. The extreme ups today caught us and our calculations off guard too.
We understand the importance of your invalidation point, but to see such optimism today…wow!
Second waves can and often do correct to very extreme degrees. If it touches 1,337.10 it will create a perfect double top, that’s how they’re created.
If this wave count is invalidated with movement above 1,337.10 then my wave count is completely wrong and we should expect new highs for the S&P.
So 1,337.1 is a very important invalidation point.
We’re not within the third wave yet, which is the tipping point where a majority of traders turn to the main trend direction.
Lara
It looks like an ABC from the Feb. low to complete wave 2.
B would be a clear impulse though, so that does not fit.
Lara, I agree.
According to the events todays (so far), none of the wave counts you went over have transpired. All your counts covered the situation of the S&P going down…no mention of what the count would be if it went up?
So now what?
That’s not entirely correct. The second, alternate wave count looked at a deep second wave correction. This is not an expanded flat as I was expecting, but it is a deep second wave correction. It is deeper than I anticipated however price remains below the invalidation point.
It is not possible for me to pinpoint accurately every day each turning point.
The big green arrow going upwards on the alternate hourly wave count indicates a deep second wave correction.
Lara
Looking at the futures neither wave count looks correct. Please advice.
It’s a deep second wave correction. It’s not an expanded flat, it’s a zigazag. At this stage it has a corrective count of 15 on the hourly chart and may be over there or very soon. I would expect it to overshoot the 0.786 ratio by a point or so then turn down.