
Elliott Wave chart analysis for the SPX500 for 28th February, 2011. Please click on the charts below to enlarge.
Upward movement for a second wave correction has invalidated yesterday’s main wave count confirming the alternate. At that stage we expected movement to end about 1,326.8 and so far it has reached up to 1,329.6.
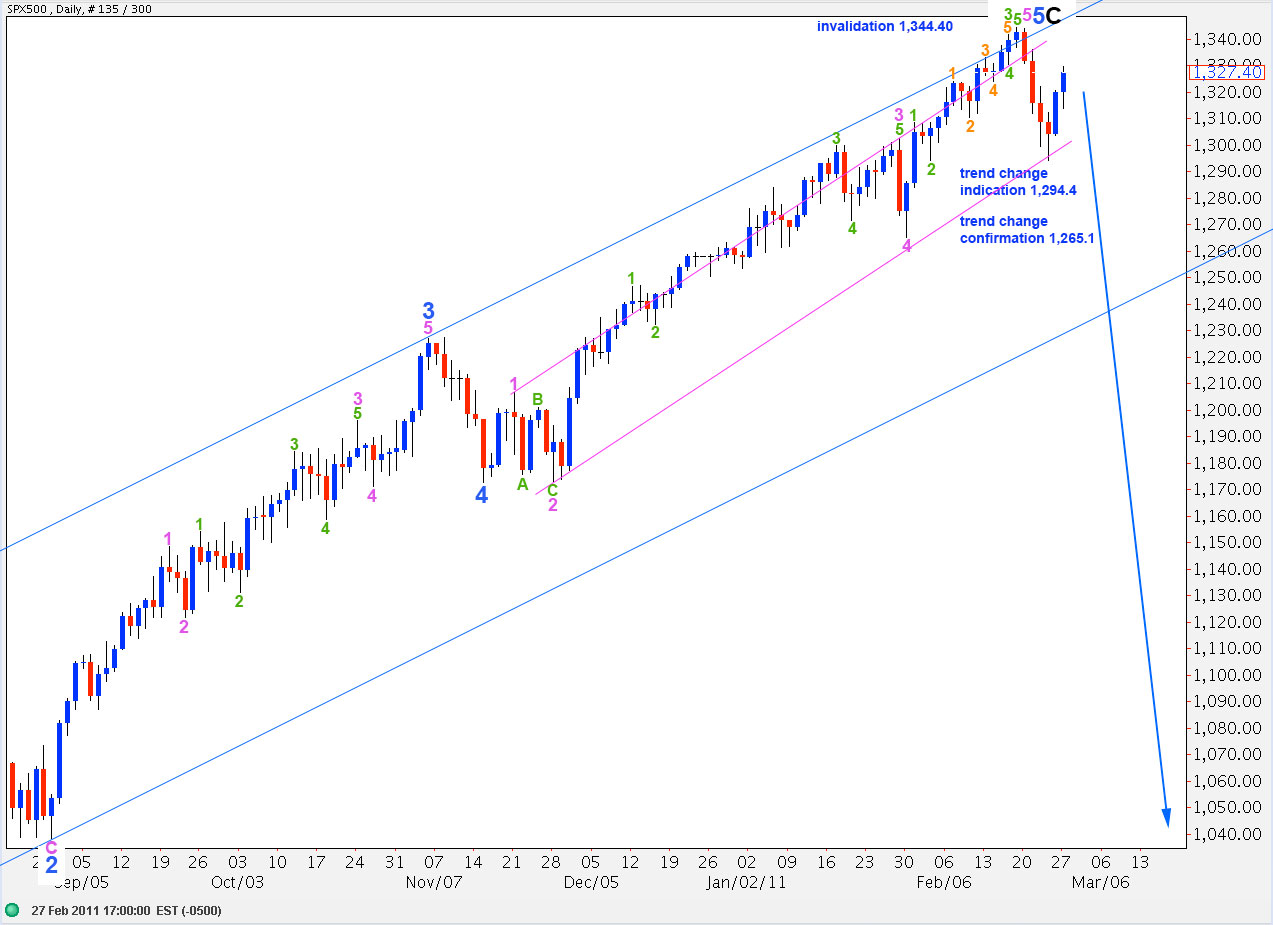
This second wave correction is not over, however. Second waves normally are deep corrections and may correct to very deep degrees. This correction may move right up to the start of wave 1 at 1,344.4 to create a perfect double top, but it may not move above. When second waves correct to such deep degrees they convince everyone that there has been no trend change, and they do this right before a strong third wave develops. The third wave then catches everyone by surprise. Be aware of this possibility.
Obviously, movement to a new high above 1,344.4 would invalidate this wave count.
We need to see movement below the pink parallel channel in the first instance to indicate a trend change. Movement below 1,265.1 may be considered confirmation of a trend change.
As this trend change is a very big one, seeing a lot of downward movement to take price below 666.8, we should have patience with it at this point. At this stage this analysis comes with this strong caveat: a trend change is highly likely, but unconfirmed.
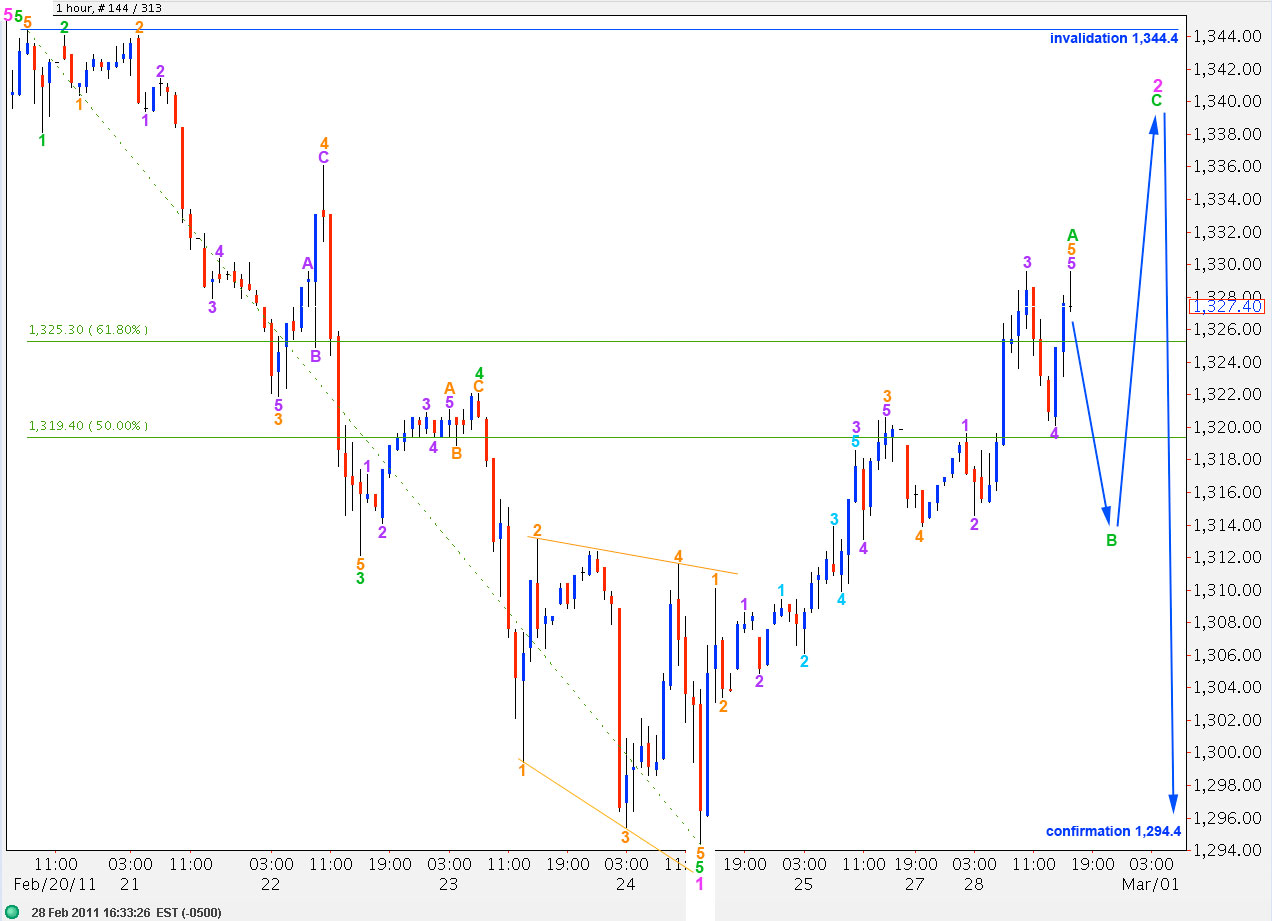
Movement above 1,322.1 invalidated the main hourly wave count, confirming this which was our alternate yesterday.
I have moved the labeling up one degree today on the hourly chart.
So far upward movement has an impulsive count. Therefore, if this is a correction it is only wave A of the correction.
Ratios within wave A green are: wave 3 orange is just 1.5 points longer than wave 1 orange and wave 5 orange is exactly equal in length to wave 1 orange.
Ratios within wave 3 orange of wave A green are: wave 3 purple is just 0.1 point longer than 2.618 the length of wave 1 purple and there is no relationship between wave 5 purple and either 1 or 3 purple.
Ratios within wave 3 purple of wave 3 orange are: wave 2 aqua is just 0.5 points longer than 1.618 the length of wave 1 aqua and no relationship between wave 5 aqua and either 1 or 3 aqua.
Ratios within wave 5 orange of wave A green are: wave 3 purple is just 0.1 point longer than 2.618 the length of wave 1 purple and wave 5 purple is 0.2 points longer than 0.618 the length of wave 3 purple.
At this stage a new low below 1,294.4 would be a strong indication of a trend change as the outlying alternate below would be invalidated at that point.
Alternate Hourly Wave Count.
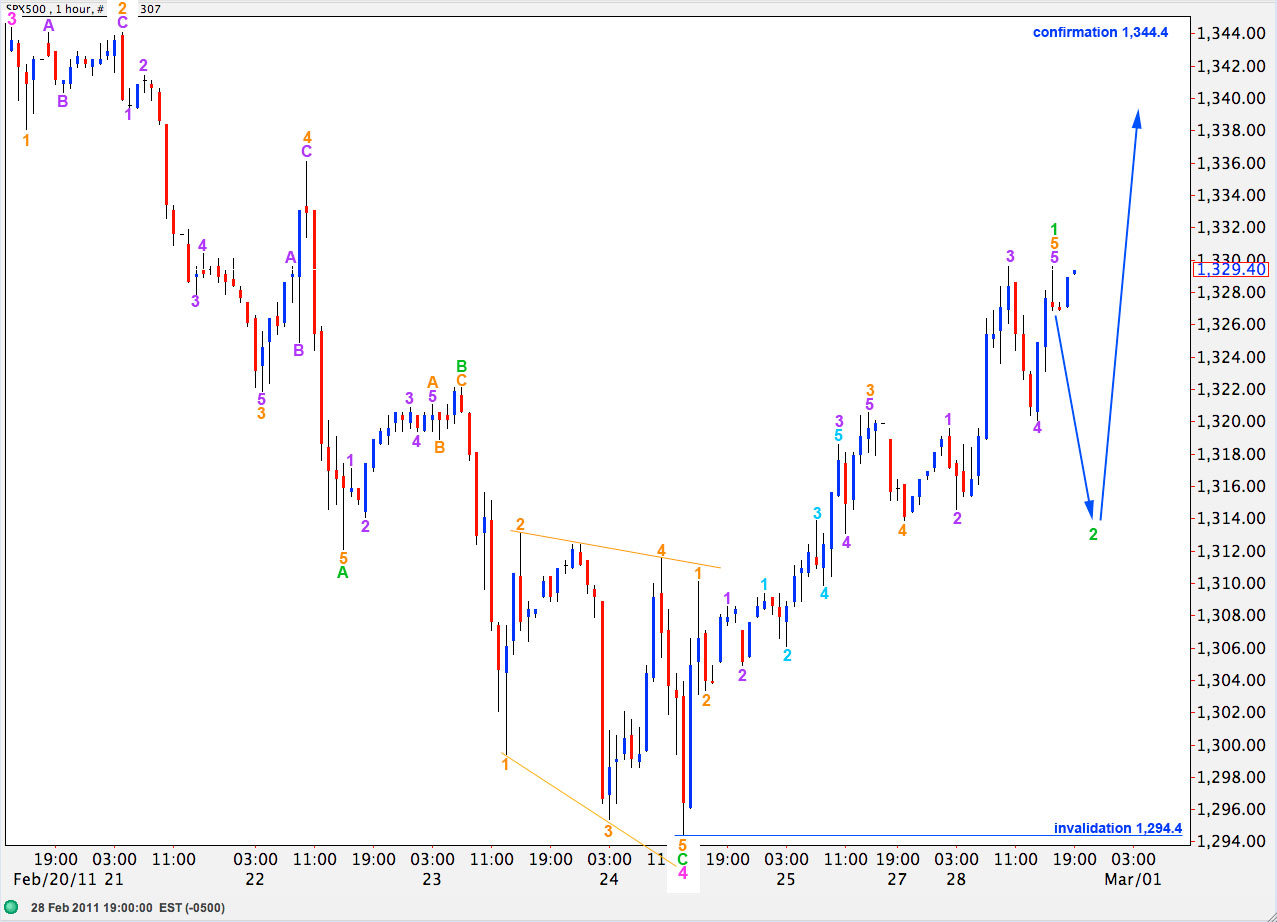
This wave count sees downward movement as a three wave structure with upward movement to follow, so far impulsive.
At the daily chart level this wave count has a horrible look. Wave 3 pink would have been over at 1,344.4 and would have a strong three wave look to it on the daily chart.
I present this wave count to illustrate why we would want to now see movement below 1,294.4 to provide strong indication of a trend change, and to illustrate this outlying technical possibility.
OK. Thanks
Lara
Are we still looking at a target of 1260 SPX before a larger 4th wave correction?
Because the trend change is unconfirmed, and I’m being extremely cautious here, I have not calculated targets yet. I will do so for today’s analysis, with the caveat that the trend change is unconfirmed. We need this third wave to end beyond the end of the first, in the first instance. Then we should set targets at wave 3 = 1.618 X wave 1.
I still want to see a channel breach on the daily chart, and movement below 1,265.1 to confirm this big trend change.
Because it’s so huge a change, at primary degree, I’m going to exercise caution. But it’s stacking up pretty well so far!
Thank you
Lara
Has todays move changed your out look as far as an ABC up before continuing down or are we in a 3rd down now?
I expect we are in a third wave down. Upwards movement is choppy and overlapping, clearly contrasting with downwards movement which is a sheer drop – so far – and looks very impulsive. The correction was just over the 0.786 ratio, a deep correction for a second wave.
Wave behaviour supports the wave count – so far. But then the drop labeled 4 pink on the daily chart was also a sheer drop, but it was a three.
This time though the first drop down has an impulsive count. The rise upwards has a corrective count.
Todays downwards movement is exactly what we should expect to see.
Thanks Lara. Always very insightful. Keeps me on my toes!
John A