
Elliott Wave chart analysis for the SPX500 for 25th February, 2011. Please click on the charts below to enlarge.
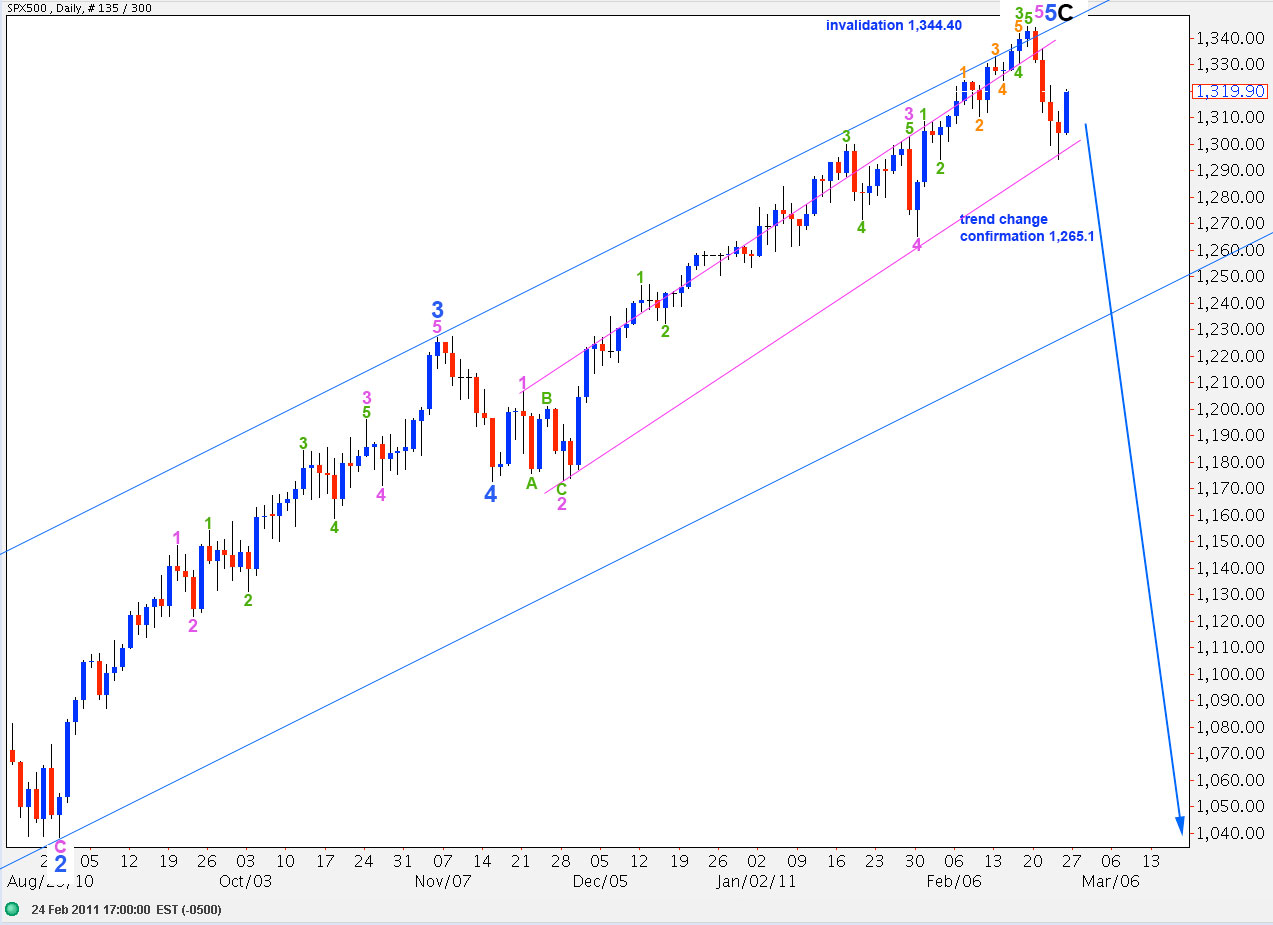
We were expecting some upward movement during Friday’s session for a small correction and this is what we got. When this correction is over the S&P should turn back downward.
I have two wave counts at the hourly chart level. The alternate is from a slightly different count sent in by Brian Metzger. The alternate allows for a deeper wave 2 correction.
Price movement below 1,265.1, and below the pink parallel channel here on the daily chart, will provide a lot of confidence that we have seen a trend change.
Primary wave 3 must move beyond the end of primary wave 1. Therefore, it must eventually take price below 666.8.
When we have a trend change confirmed then I will calculate downward targets for you. To do so at this stage would be premature.
Movement above 1,344.4 would invalidate this wave count.
Main Hourly Wave Count.
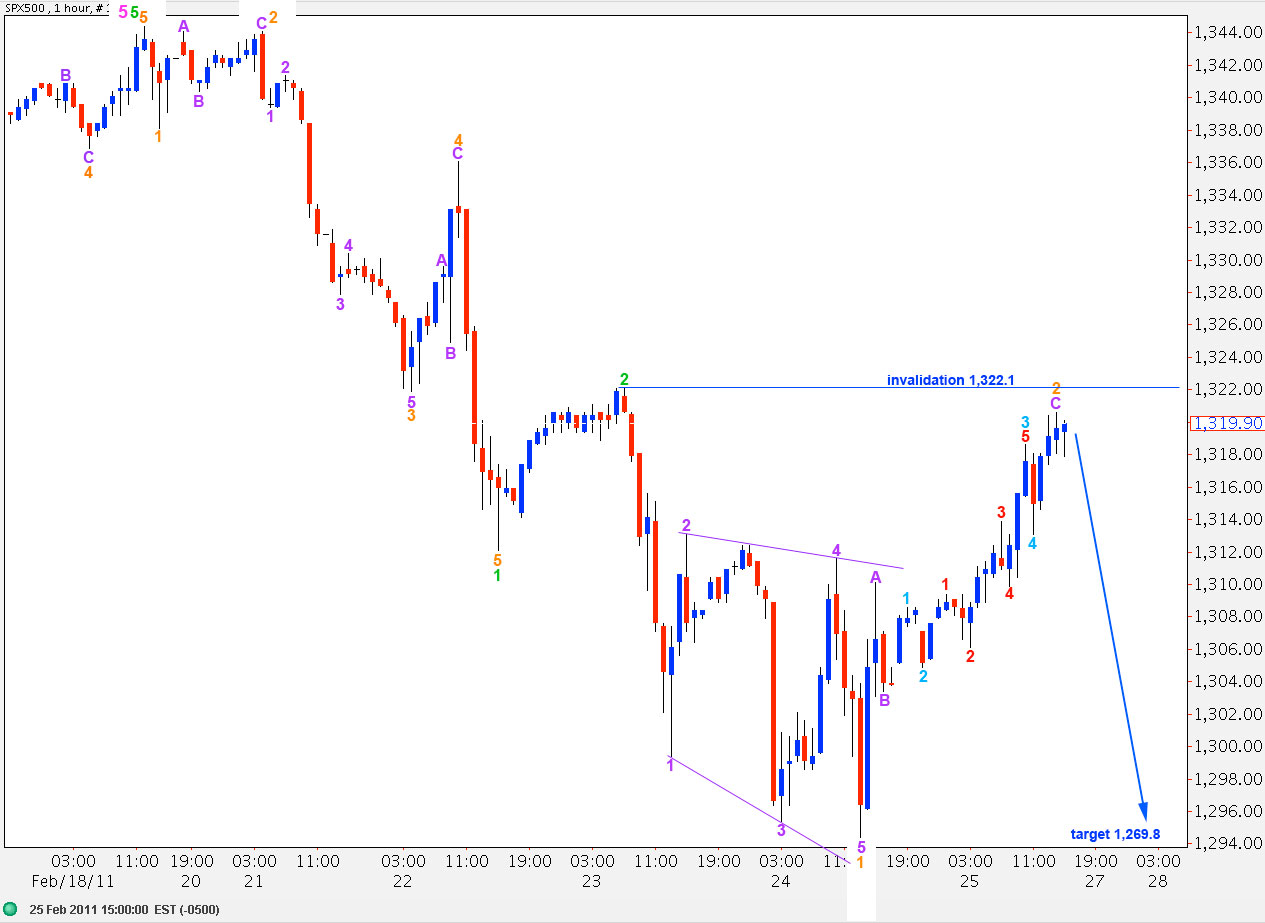
This follows on directly from our previous hourly wave count. Wave 2 orange must be over here, or extremely close to it, as it may not move beyond the start of wave 1 orange at 1,322.1.
Ratios within wave 1 green are: wave 3 orange has no fibonacci ratio to wave 1 orange and wave 5 orange is 2.7 points short of 4.236 the length of wave 1 orange. Wave 5 orange is also 1.8 points short of equality with wave 3 orange.
Within wave 2 orange wave C purple is just 1.5 points longer than equality with wave A purple.
Ratios within wave C purple are: wave 3 aqua is just 0.1 points longer than 2.618 the length of wave 1 aqua and wave 5 aqua is just 0.9 points short of 1.618 the length of wave 1 aqua.
Ratios within wave 3 aqua of wave 3 purple are: wave 3 red is 0.5 points longer than 1.618 the length of wave 1 red and wave 5 red is 0.9 points longer than equality with wave 3 red.
If this wave count is correct the next move for the S&P should be strong downward movement as a third wave develops.
If we see a little further upward movement above 1,322.1 then we should use the alternate wave count below.
Alternate Hourly Wave Count.
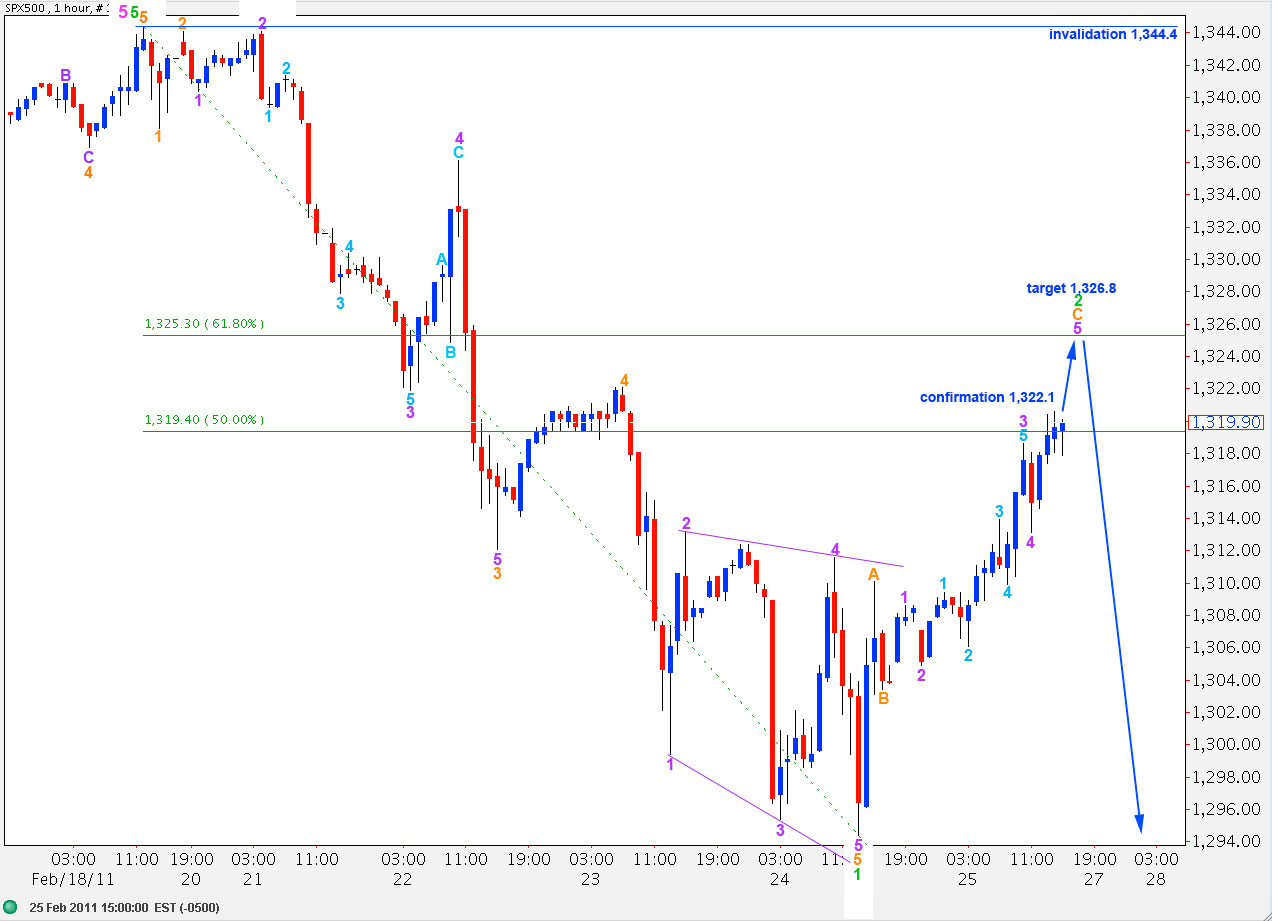
The key difference between this alternate wave count and the main hourly wave count is how movement labeled 2 orange and 1 and 2 purple within 3 orange is seen. This alternate wave count sees wave 2 purple as a zigzag while the main wave count sees that piece of movement as an ending diagonal. On the 15 minute chart it has a nice five wave diagonal structure and so this wave count, which sees it as a three, would therefore have a lower probability.
This wave count sees downward movement as a five wave structure complete at 1,294.4.
Ratios within green wave 1 are: orange wave 3 has no fibonacci ratio to orange wave 1 and orange wave 5 is 1.01 points longer than 4.236 the length of orange wave 1.
Ratios within orange wave 3 are: purple wave 3 has no fibonacci ratio to purple wave 1. Purple wave 5 is 1.36 points short of 6.854 the length of purple wave 1, and it is also 1.8 points longer than purple wave 3.
Ratios within purple wave 3 of orange wave 3 are: aqua wave 1 is 1.2 points longer than 2.618 the length of aqua wave 1, and aqua wave 5 is 0.2 points longer than aqua wave 3.
If wave 2 green extends any higher then it may end about 1,326.8 where wave 5 purple within wave C orange will reach equality with wave 3 purple.
Lara,
Now that the main wave count has been invalidated, I was just wondering whether you favor a move to new highs and a continuation of Wave C, rather than the alternate wave count that sees Wave C as over. The reason I ask is that you recently suggested that a move above 1322.1 would likely lead to new highs, and we have now clearly breached that to the upside.
Thanks,
Peter