
Elliott Wave chart analysis for the SPX500 for 16th February, 2011. Please click on the charts below to enlarge.
We have just two hourly wave counts today. The situation is a little clearer. I favour the main wave count slightly as it has a better overall look.
We may have one more upward wave, 5 green, to end this structure, or we may have a high in place at 1,337.6.
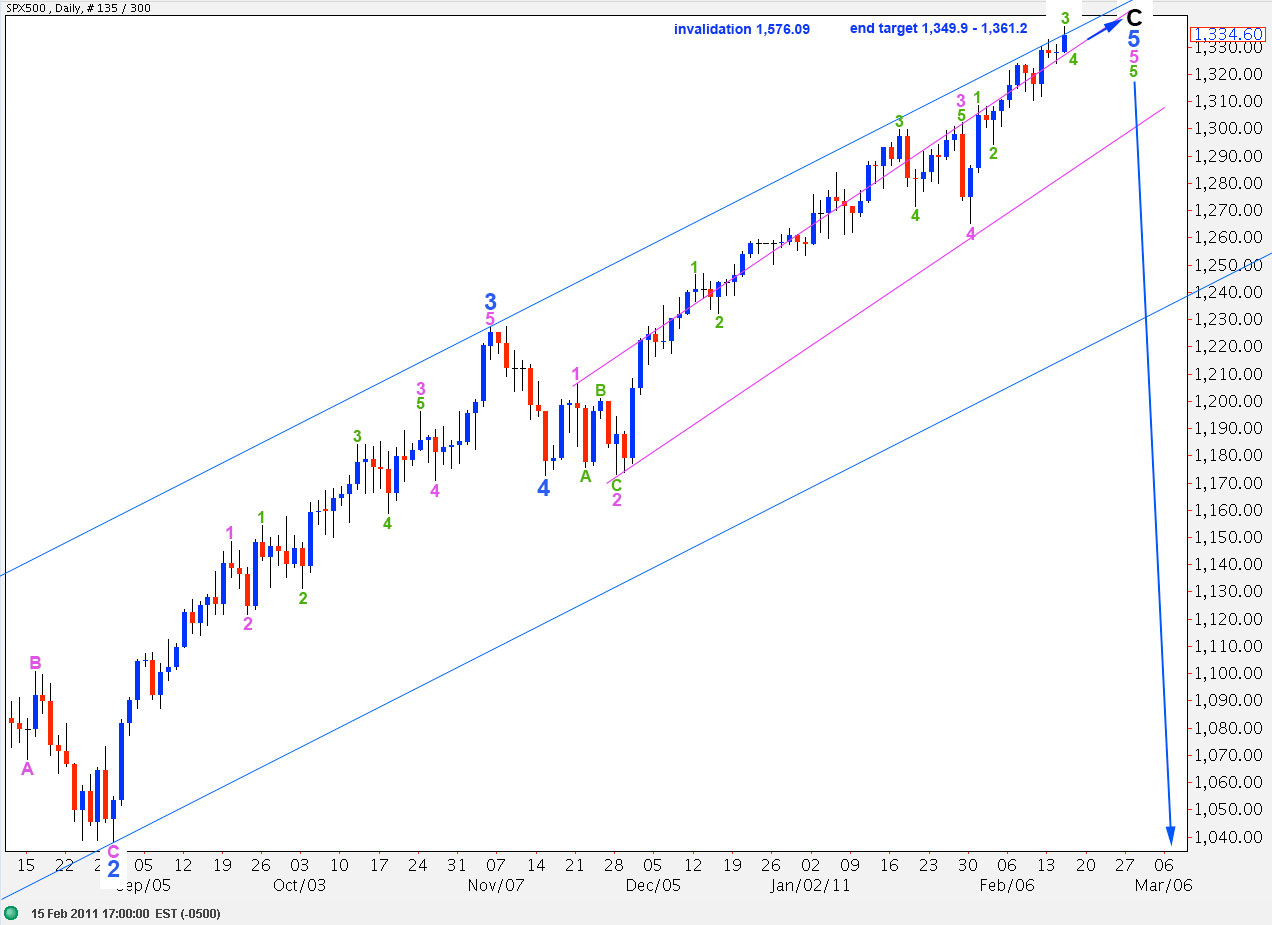
We should assume that the trend remains the same, until proved otherwise. At this stage we should wait for movement below 1,265.1, being the end of wave 4 pink, to confirm a trend change. Movement first below the smaller pink parallel channel and then the wider blue parallel channel will also provide confirmation of a trend change.
The target for this upward movement to end is between 1,349.9 where wave C black will reach 0.618 the length of wave A black, and 1,361.2 where wave 5 blue will reach equality with wave 3 blue.
This main wave count is invalidated with movement above 1,576.09.
If upward movement reaches 1,485.16 then our alternate weekly wave count will become our main wave count and we may expect further upward movement.
Main Hourly Wave Count.
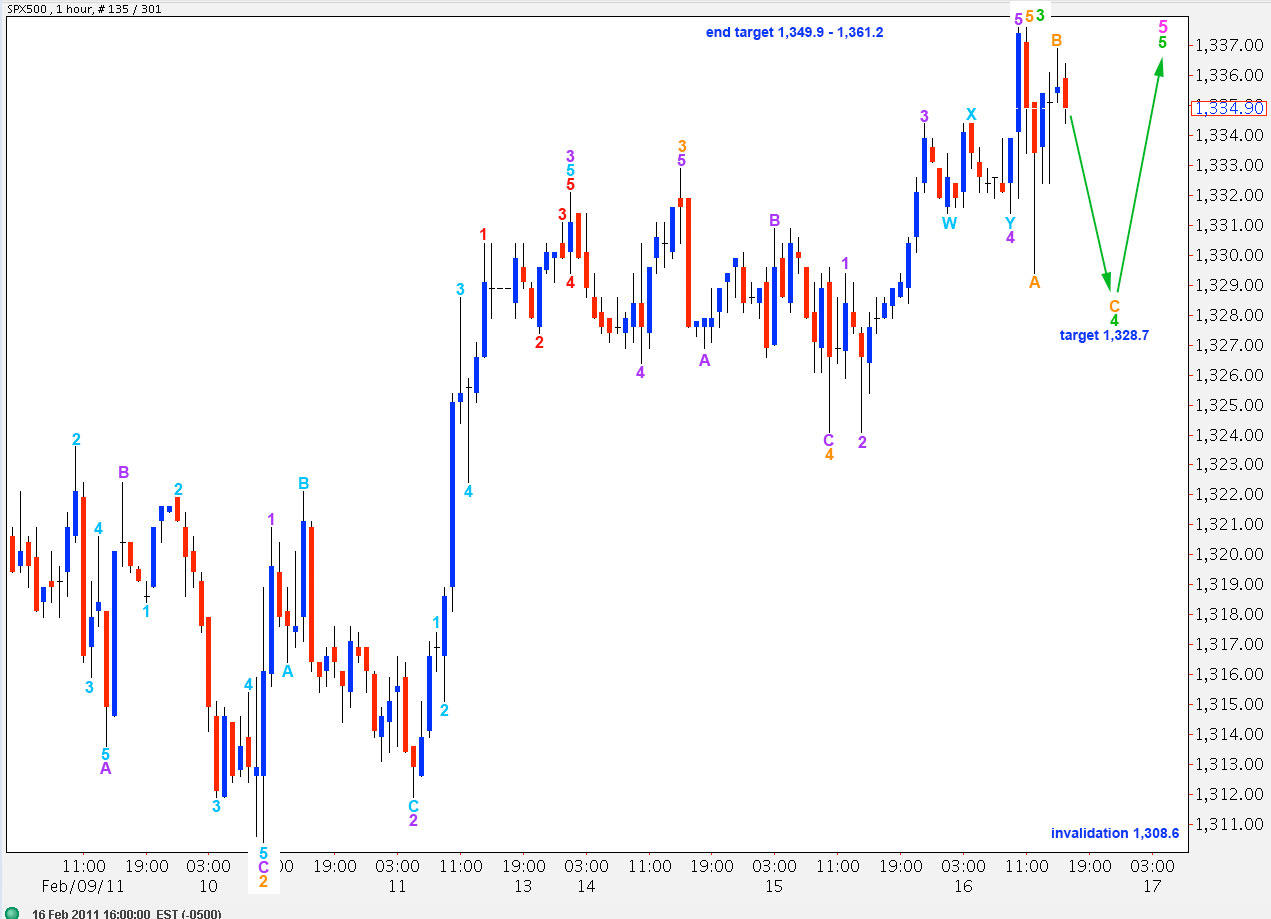
This wave count was yesterday’s first alternate. It had a short term target for wave 5 orange to end wave 3 green at 1,337.9 to 1,338. This wave has ended just 0.3 short of the target at 1,337.6.
Wave 5 orange is a clear five wave impulse. Within it wave 3 purple has no fibonacci ratio to wave 1 purple and wave 5 purple is just 0.2 short of 0.618 the length of wave 3 purple.
Ratios within green wave 3 are: orange wave 3 has no fibonacci ratio to orange wave 1 and orange wave 5 is just 0.4 short of 0.618 the length of orange wave 3.
Wave 4 green is likely unfolding as a regular flat correction. Wave A orange is a clear three on a 15 minute chart. Wave B orange is most likely over and is a 91% correction of wave A orange. Wave C orange will reach equality with wave A orange at 1,328.7.
When we have a complete structure for wave 4 green we may expect one more wave upward for wave 5 green. This may last about a week or so.
Wave 4 green may not move into wave 1 green price territory. Therefore, movement below 1,308.6 would invalidate this wave count.
Alternate Hourly Wave Count.
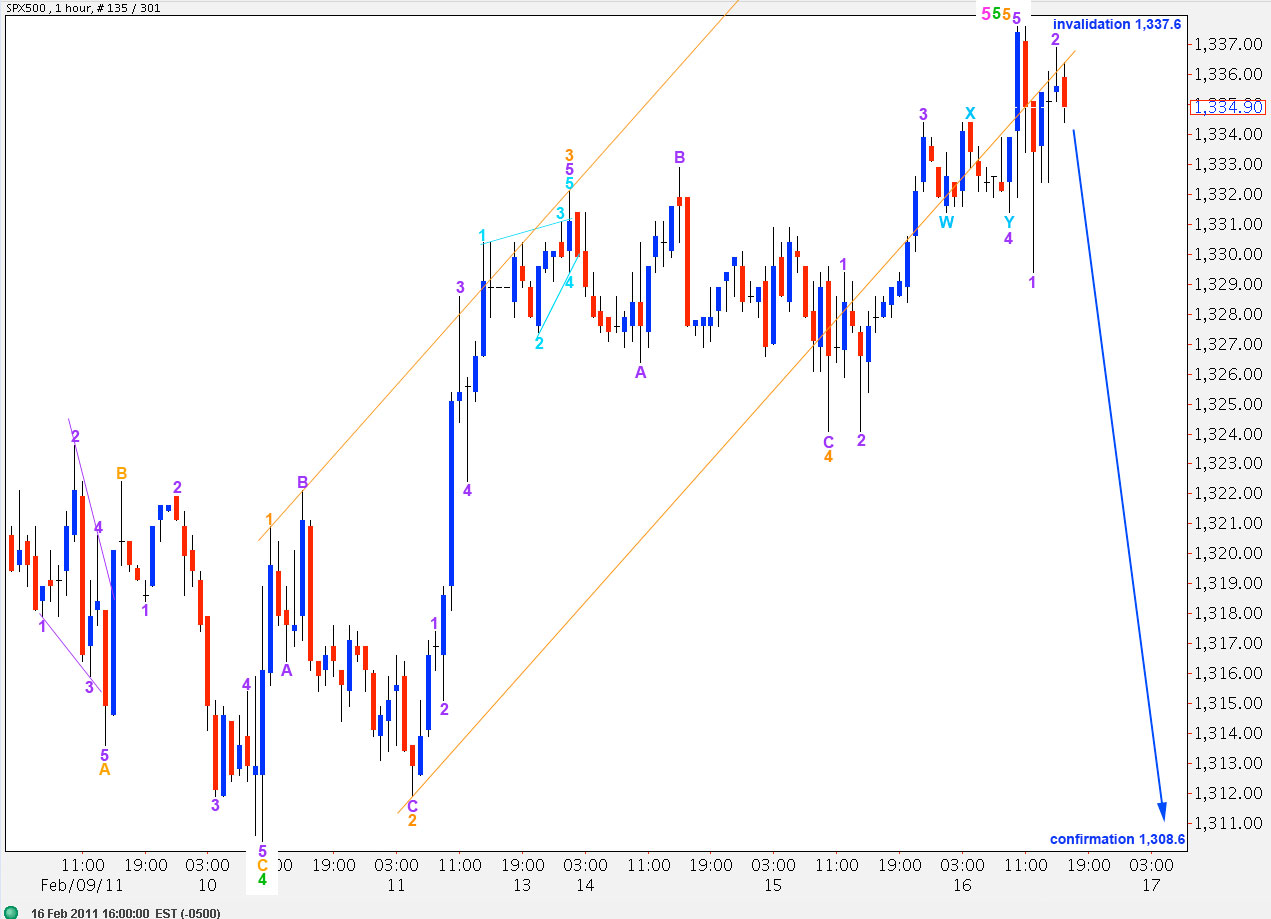
This was yesterday’s main hourly wave count. Today it is our alternate only because we should assume that the trend remains the same, until proved otherwise.
If we have a high in place then ratios are now a little better than the last possible high.
Wave C black is now just 12.3 points short of 0.618 the length of wave A black.
Ratios within wave C black are: wave 3 blue is 8.6 points short of 1.618 the length of wave 1 blue and wave 5 blue has no fibonacci ratio to either of 1 or 3 blue.
Ratios within wave 5 blue are: wave 3 pink is 15 points short of 4.236 the length of wave 1 pink and wave 5 pink is 7.4 points short of 0.618 the length of wave 3 pink.
Ratios within wave 5 pink are: wave 3 green is 2.8 points short of 0.618 the length of wave 1 green and wave 5 green is 2.5 points short of equality with wave 3 green.
Ratios within wave 5 green are: wave 3 orange has no fibonacci ratio to wave 1 orange and wave 5 orange is just 1 point longer than 0.618 the length of wave 3 orange.
Wave 1 purple has a clear three wave look on a 15 minute chart and we may be seeing a leading diagonal begin for movement downward.
Movement above 1,337.6 would invalidate this wave count. Unfortunately the confirmation point is not close by: it is at 1,308.6 because that is where the main hourly wave count is invalidated.
However, we would be best to wait for movement below 1.265.1 to confirm a trend change, as that would invalidate any alternate which saw downwards movement as a second wave correction within wave 5 pink.
…as a quick follow up, are you able to save your labels? I’m not quite sure on how to save my labels. I end up relabeling each time I re-open a new natdania session.
Thanks Again,
John
sorry for my delayed response John.
I prepare my charts in photoshop. So each day I screen shot NetDania and simply copy the labels for yesterday over to the new chart, so yes, in this manner I save labels and save time.
Thanks Lara.
It looks like the main count is on track.
I’ve been using the Netdania charts now since you mentioned what you are using. I have thus been able to follow much more closely with your work and trying to apply the EW’s on my own.
Your work has been very helpful.
As best I can tell, (and I’m quite the novice), you appear spot on!
Thanks So Much!
John