
Elliott Wave chart analysis for the SPX500 for 9th February, 2011. Please click on the charts below to enlarge.
The S&P has moved lower, which was not what was initially expected, but the hourly wave count remains valid.
It is still not possible to see a satisfactory complete wave structure for wave 5 green on the hourly chart. Therefore, we should expect further upward movement.
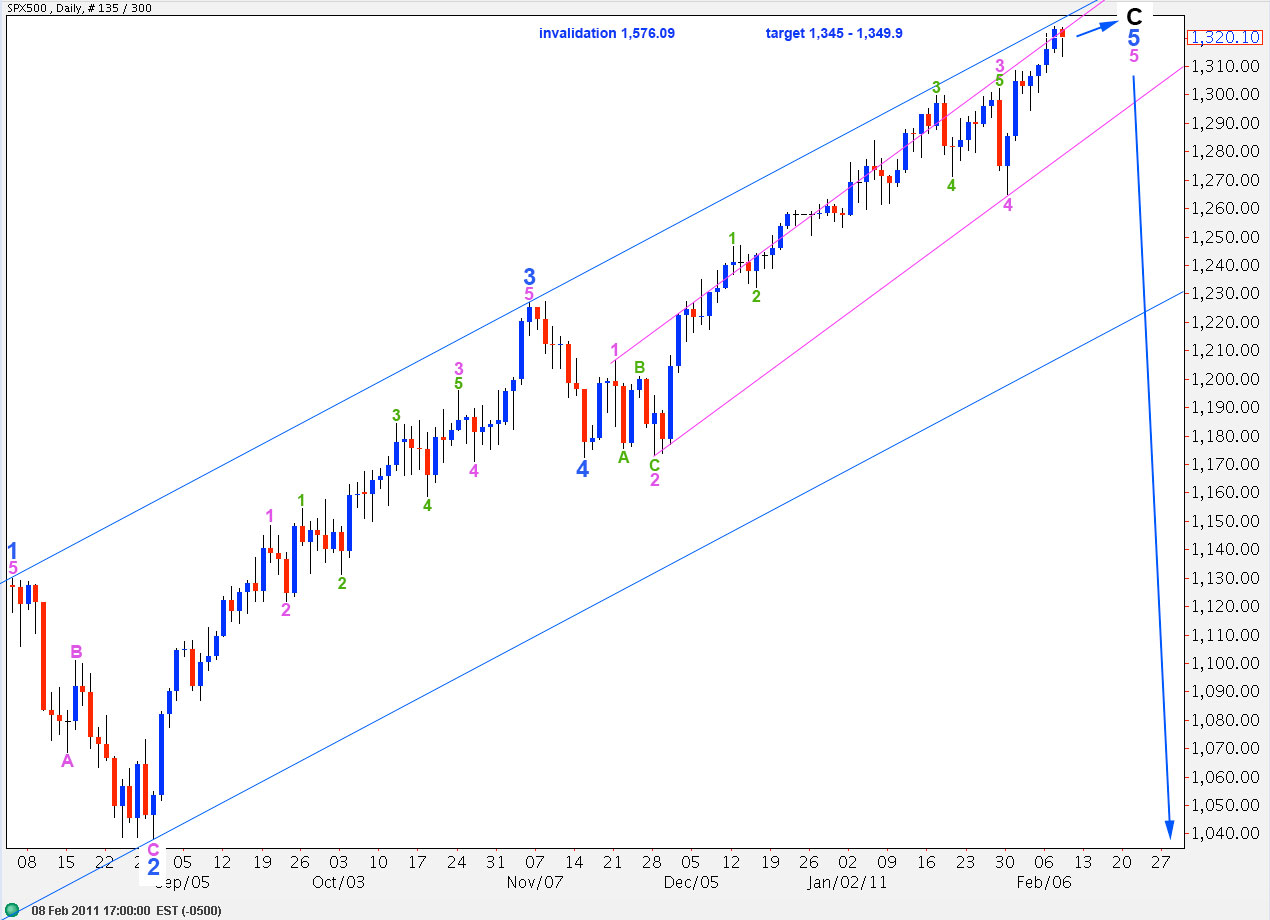
At 1,345 wave 5 pink within wave 5 blue will reach 0.618 the length of wave 3 pink. At 1,349.9 wave C black will reach 0.618 the length of wave A black.
For this main wave count primary wave 2 may not move beyond the end of primary wave 1. Therefore, movement above 1,576.09 would invalidate this wave count.
We can now see two small corrections on the daily chart within wave 5 green. For this reason I have developed the alternate wave count below which has slightly better fibonacci ratios than the main count.
Main Hourly Wave Count.
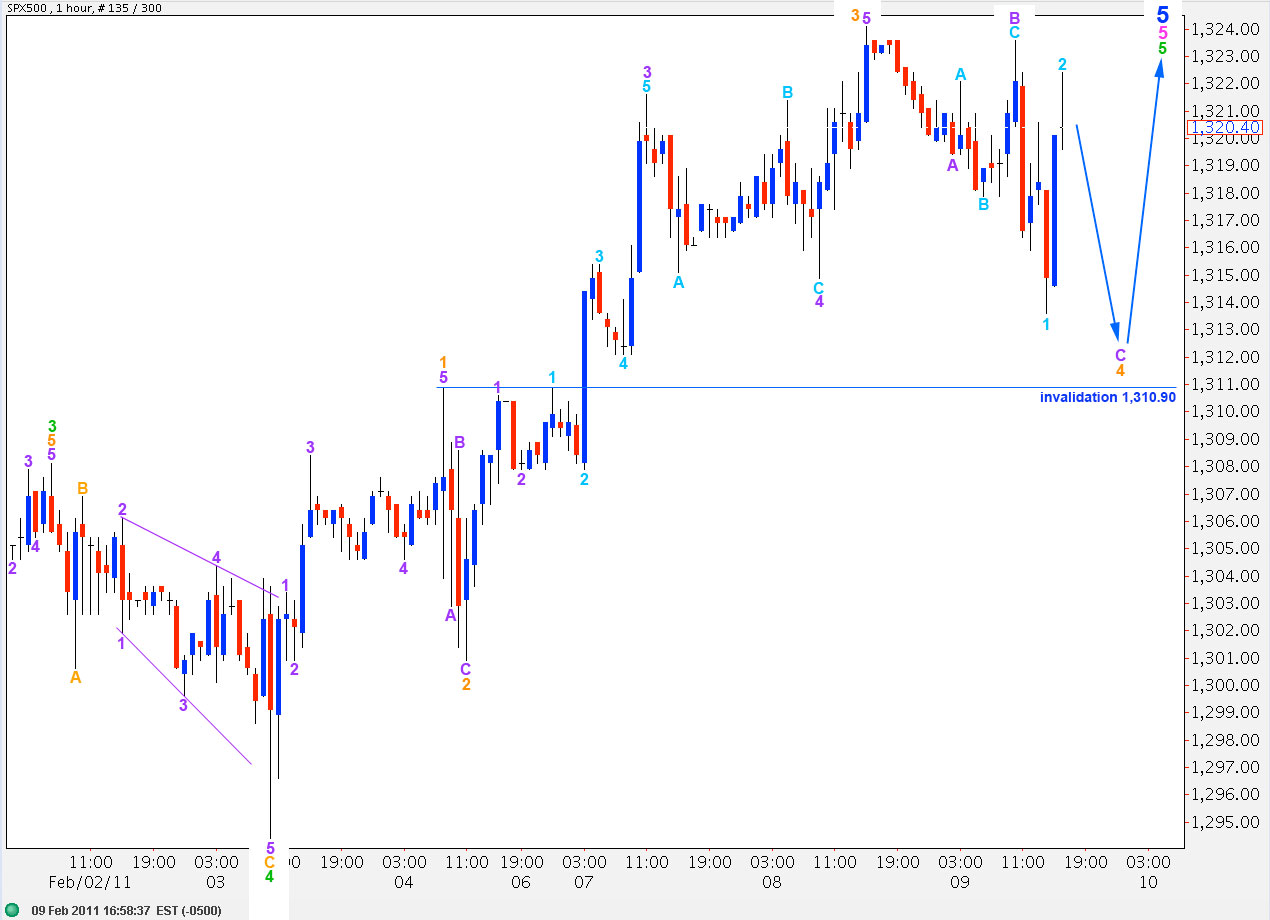
This main hourly wave count sees a short wave 1 green within wave 5 pink. This wave count sees wave 5 green as extending and yet to complete.
This main wave count fits best with MACD: wave 3 green has the strongest MACD reading and we have divergence between price trending higher for wave 5 green while MACD trends lower.
There is no fibonacci ratio between waves 1 and 3 green.
Ratios within wave 3 green are: wave 3 orange is 2.3 points longer than equality with wave 1 orange. Wave 5 orange is just 0.2 points short of 0.236 the length of wave 3 orange.
Within wave 4 orange wave C purple is incomplete. It is most likely unfolding as an ending diagonal.
Wave 4 orange may not move into wave 1 orange price territory. Therefore, this wave count is invalidated with movement below 1,310.9.
Alternate Hourly Wave Count.
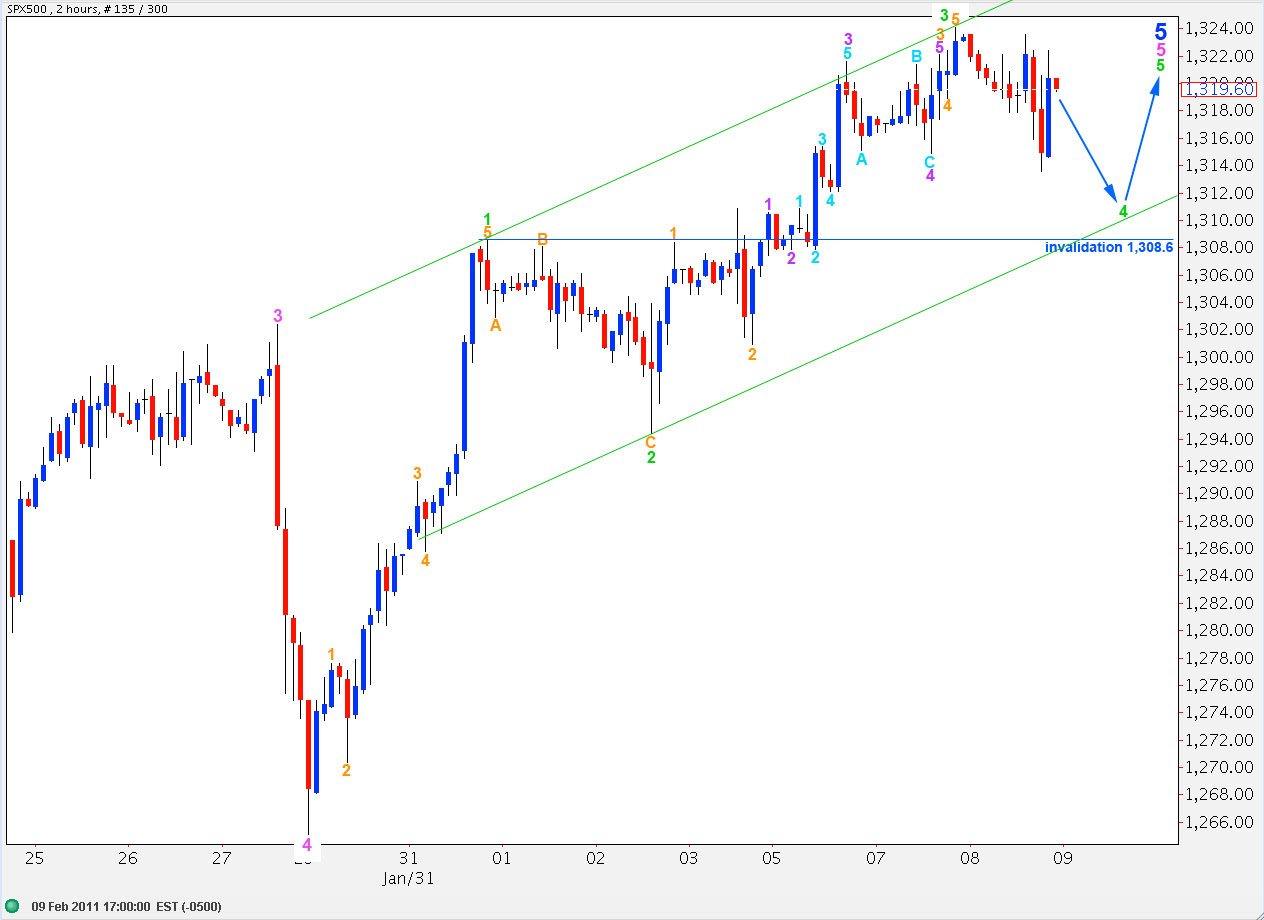
The 2 hourly chart above details all of this fifth wave at pink (minute) degree so far. This wave count sees wave 5 green as yet to begin.
Wave 3 green is just 2.8 points short of 0.618 the length of wave 1 green. Therefore, wave 5 green may not be longer than wave 3 and has a maximum length of 29.7 points.
Ratios within wave 1 green are: wave 3 orange is just 0.3 points longer than 1.618 the length of wave 1 orange and wave 5 orange is 2.3 points longer than equality with wave 3 orange.
Ratios within wave 3 green are: wave 3 orange is 1.5 points short of 1.618 the length of wave 1 orange and wave 5 orange is just 0.2 points longer than 0.236 the length of wave 3 orange.
Wave 4 green may not move into wave 1 green price territory. Therefore, this wave count is invalidated with movement below 1,308.6.
The trend channel fits better with this wave count also. We may expect this fourth wave correction to end about the lower green trend line. The following fifth wave may end about the upper edge, or midway in the channel.
When this channel is significantly breached to the downside, following satisfactory completion of wave 5 green, we may then use the breach of the channel to indicate a trend change.
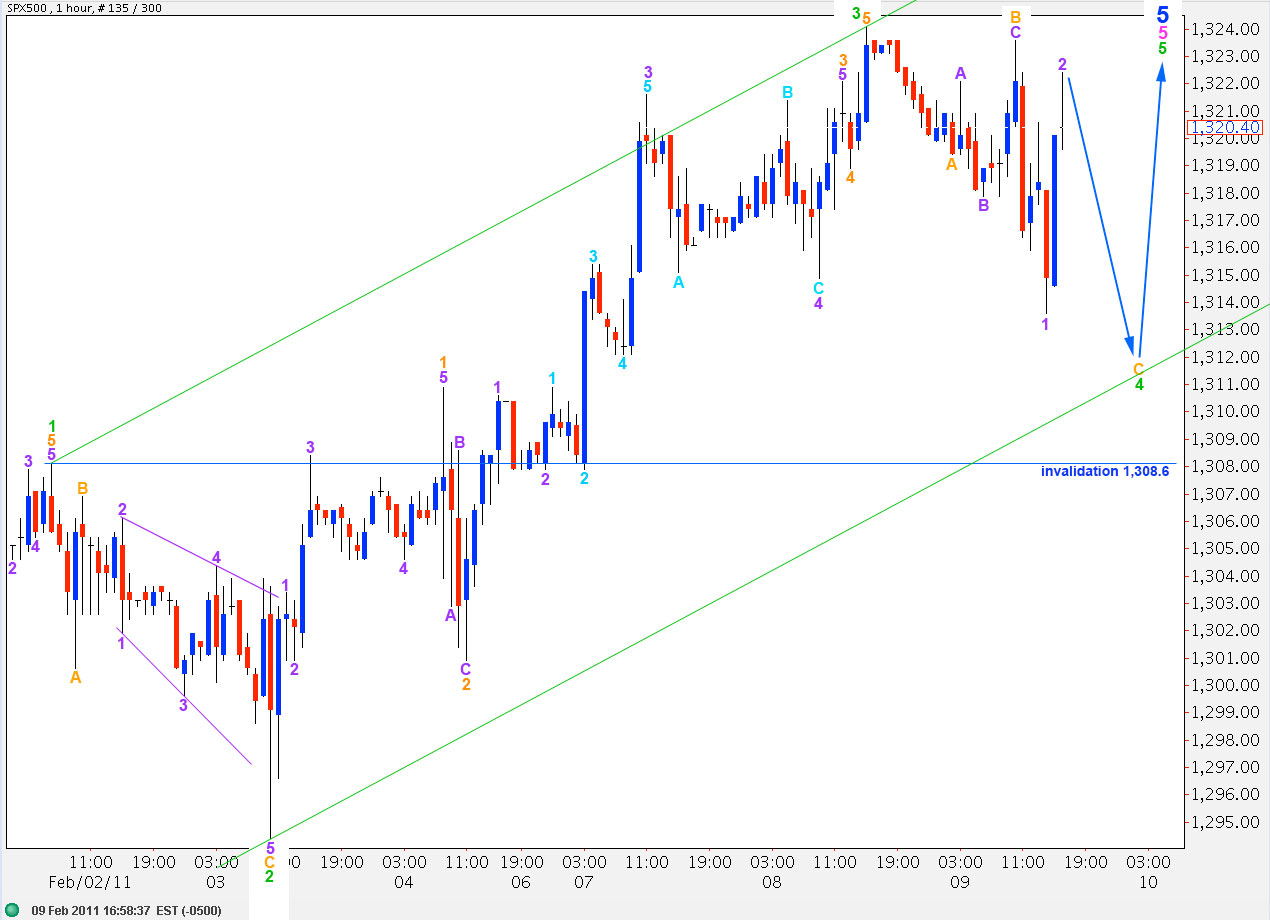
This hourly chart chart details all of wave 3 and 4 green.
Labeling of most recent movement for wave 4 differs from the main hourly wave count only in degree. We should still see further downward movement to complete this structure before seeing price turn back up.
Thanks again for all your hard work. I do follow it each day double checking my counts with yours. I see it as you see it.
Thanks,
John A
Thank you John. Yes, this time I am much more confident we are at the end of this upwards wave. It is looking so mature now at all wave degrees, it needs one final small upwards wave to end it and it’s nice to have a maximum point which price should not go above.
I expect we may have that big trend change in another 1 or 2 trading days. By the end of next week prices should be a lot lower, and downwards movement should be very strong and volatile.
When it starts to move downwards the upwards corrections may be swift and deep, making this next wave down difficult to trade and possibly difficult to analyse also.