
Elliott Wave chart analysis for the SPX500 for 7th February, 2011. Please click on the charts below to enlarge.
Our alternate hourly wave count was quickly invalidated on Monday, leaving the main wave count valid. Thereafter, as expected, we have seen further upward movement from the S&P toward the target zone.
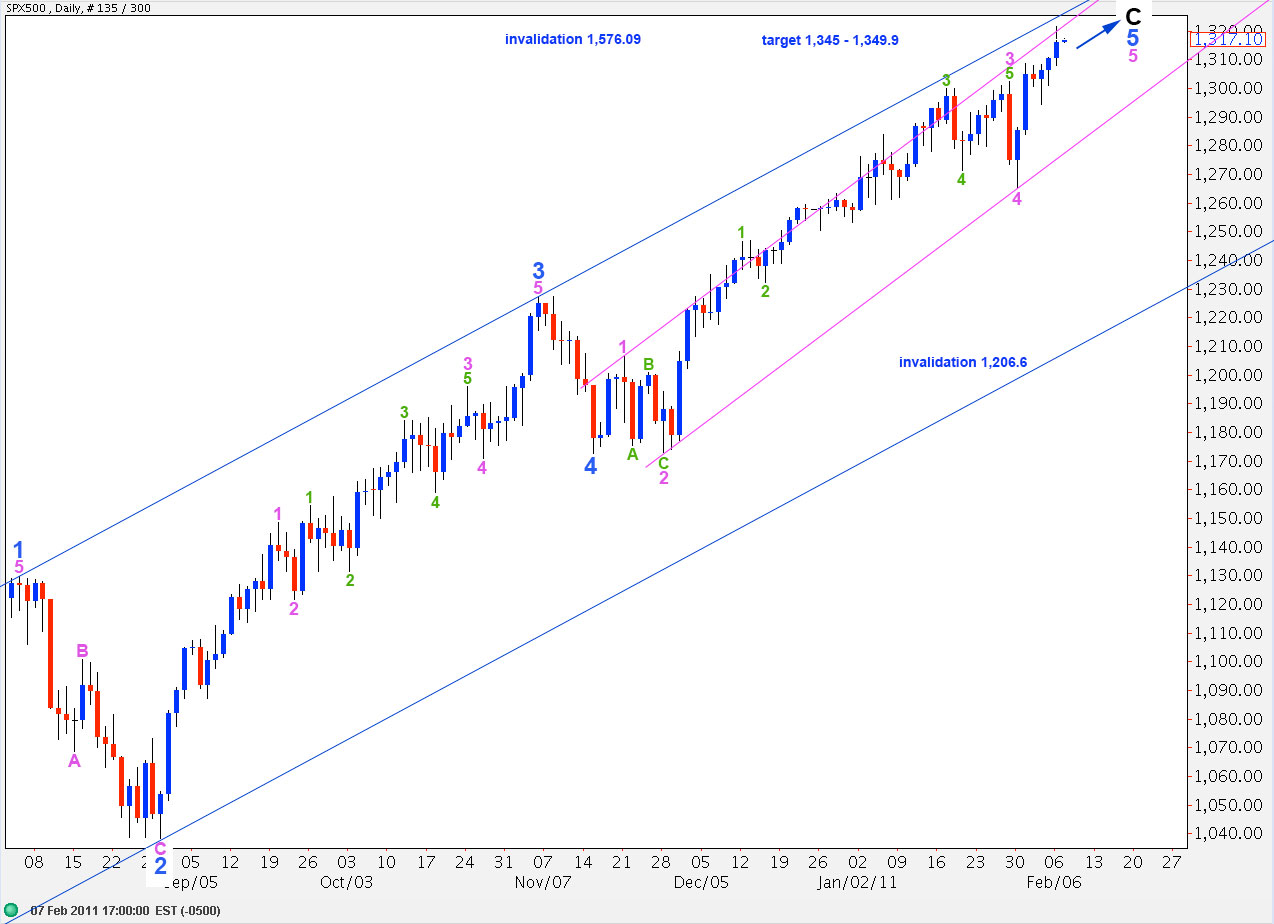
We may expect further upward movement this week for the S&P to bring price to the upper edge of the blue parallel channel here on the daily chart, and to overshoot the pink parallel channel.
At 1,345 wave 5 pink within wave 5 blue will reach 0.618 the length of wave 3 pink. At 1,349.9 wave C black will reach 0.618 the length of wave A black.
For this main wave count primary wave 2 may not move beyond the end of primary wave 1. Therefore, movement above 1,576.09 would invalidate this wave count.
Our alternate historical weekly wave count expects price to rise above 1,485.16 minimum. If this price point is reached the historical count will become our main wave count, which allows for new highs for the S&P before a strong downward wave to new lows.
Our main hourly wave count expected further upward movement. We do not now have a complete wave structure for wave 5 pink so we need more upward movement.
It looks likely that the S&P may reach our target zone on the daily chart.
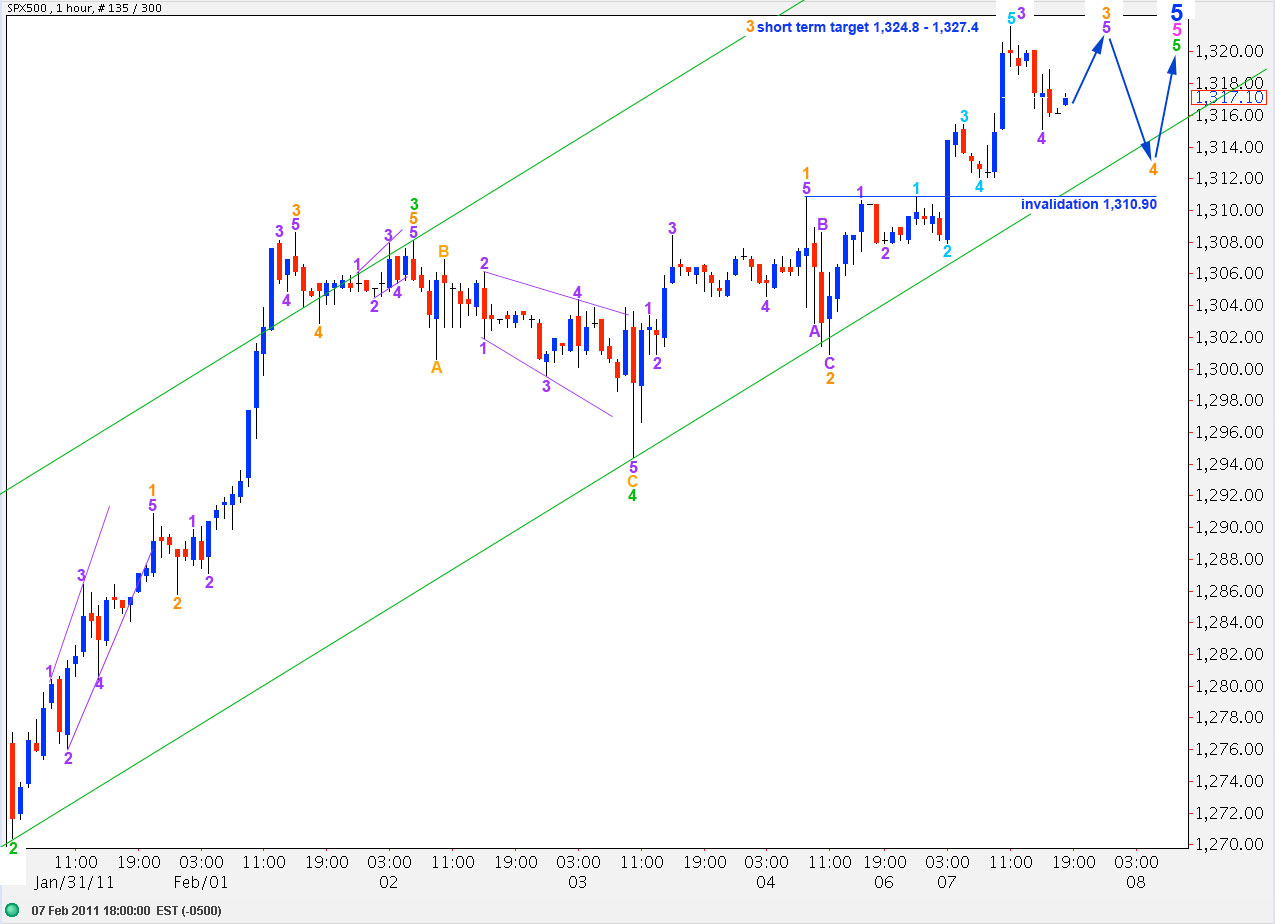
Ratios within wave 3 purple are: wave 3 aqua is just 0.3 short of 2.618 the length of wave 1 aqua and wave 5 aqua has no fibonacci ratio to either 1 or 3 aqua.
We should see one more upward movement to end wave 3 orange. At 1,327.4 wave 3 orange will reach 1.618 the length of wave 1 orange. At 1,324.8 wave 5 purple will reach equality with wave 1 purple. Therefore, this is our short term target zone for this next upward wave.
To follow, this wave 4 orange may not move into wave 1 orange price territory. Therefore, this wave count is invalidated with movement below 1,310.9.
Wave 5 orange to end wave 5 green and, therefore, all upward movement may end about midway in this green parallel channel (most likely) or at the upper end of the channel (less likely).
When we can see significant movement outside and below this parallel channel we shall have our first indication that we may have seen a trend change for the S&P.
I like you counts. They look good to me.
I know I was doubtful on that long horizontal 4th wave, but, I think you’re spot on.
John