
Elliott Wave chart analysis for the SPX500 for 12th January, 2011. Please click on the charts below to enlarge.
The S&P has behaved exactly as expected for last session and is now within the target zone.
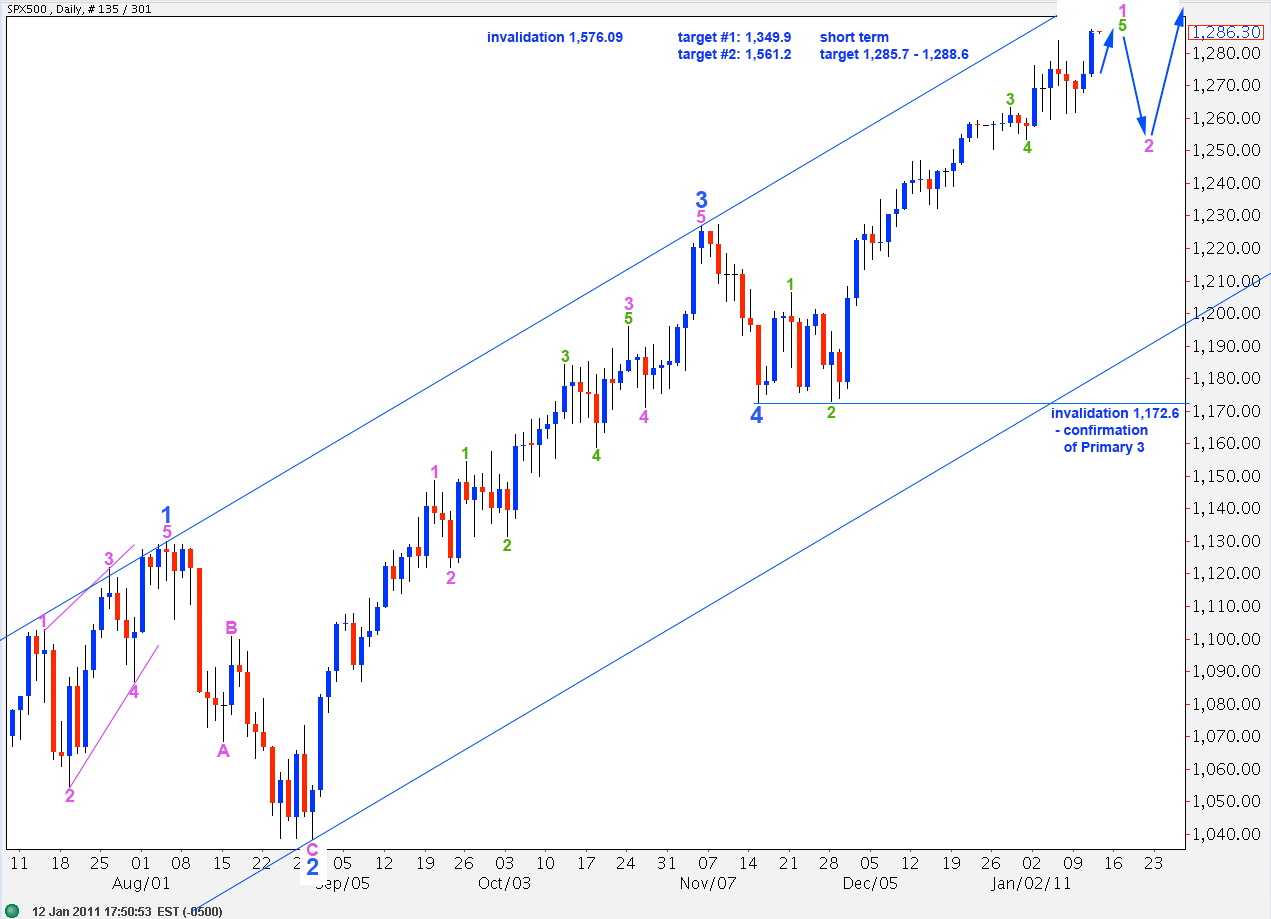
The structure for this last wave upward is incomplete. It requires one small and final upward wave at aqua degree. Thereafter, we will have a complete and satisfactory ending diagonal for wave 5 green which meets all rules and guidelines. At that stage we may see a trend change which may be at minute degree, or possibly at primary degree.
The degree of labeling here expects the next move down will be a second wave at minute degree. Wave 2 pink may not move beyond the start of wave 1 pink. Therefore, this wave count is invalidated with movement below 1,172.6. When we have a complete structure upward for wave 5 green then we should draw a fibonacci retracement from the low labeled 4 blue on the daily chart here, up to the high. We may use the 0.618 fibonacci ratio of wave 1 pink as the most likely point for wave 2 pink to end.
When wave 2 pink is over this wave count sees further upward movement and new highs for the S&P toward a most likely target of 1,561.2 where wave C black will reach equality with wave 1 black.
If downward movement that we are expecting takes price below 1,172.6 then the trend change was most likely at primary degree. At that stage we should use the alternate degree of labeling below.
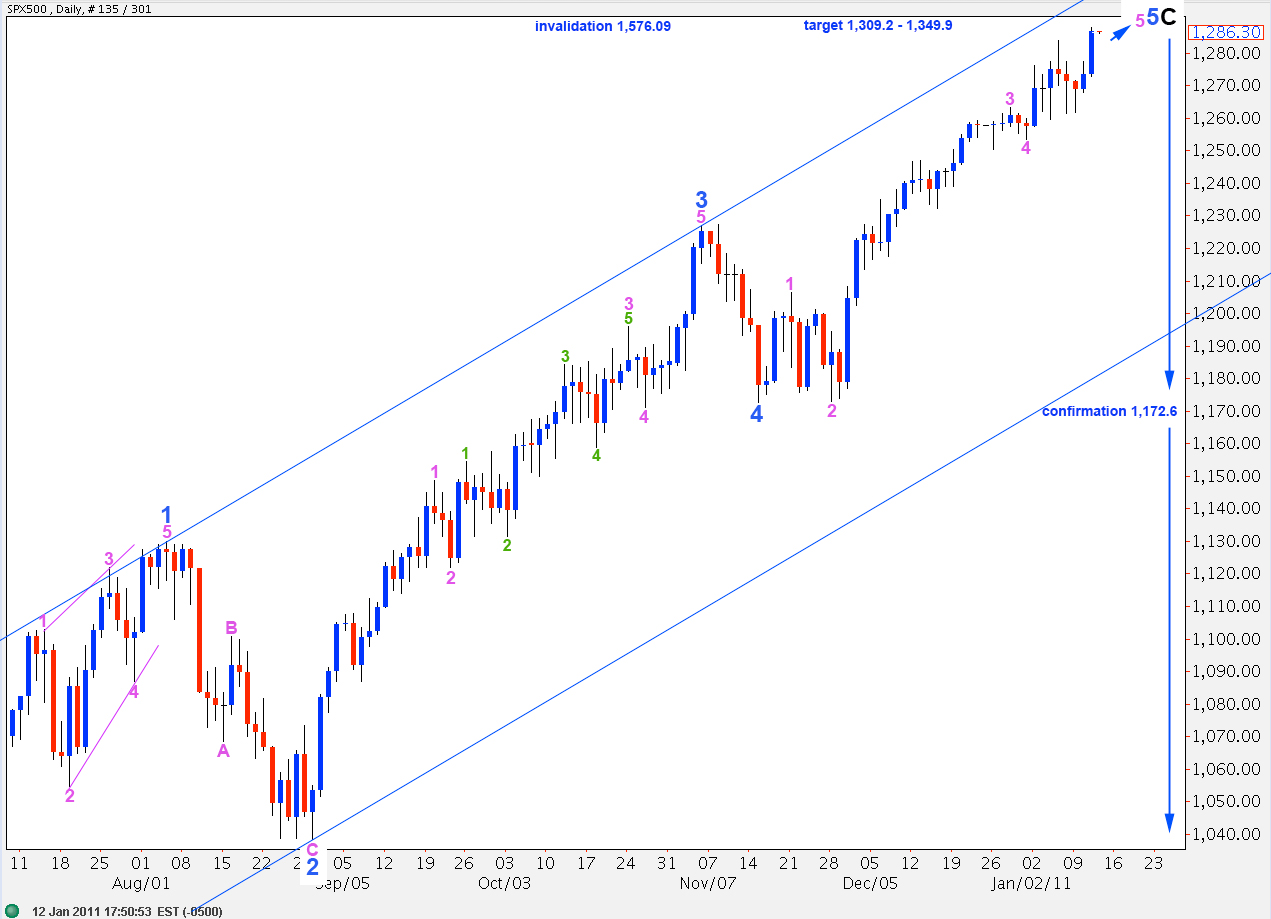
If the trend change that we are expecting is at primary degree then downward movement may be very strong, even volatile.
Primary wave 3 may take over a year to complete and it must take price below 666.80.
We will know fully and finally that primary wave 3 is underway if price moves below 1,121.9 as at that stage downward movement may not be a fourth wave correction (although that would leave wave 3 blue on the daily chart as having a very strong three wave look). If price moves below 1,172.6 then the probability that it will continue below 1,121.9 may be considered very high indeed, at this stage.
Recent upward movement was exactly as expected.
Wave 3 aqua has no fibonacci ratio to wave 1 aqua.
Ratios within wave 3 aqua are: wave 3 red is 2.3 points longer than 1.618 the length of wave 1 red and wave 5 red is 0.9 points short of 0.618 the length of wave 1 red.
Ratios within wave 3 red are: wave 3 teal has no fibonacci ratio to wave 1 teal and wave 5 teal is 0.4 points longer than 0.618 the length of wave 3 teal.
Ratios within wave 3 teal are: wave 3 maroon is 0.59 points short of 4.236 the length of wave 1 maroon and wave 5 maroon is 0.5 points short of 0.382 the length of wave 3 maroon.
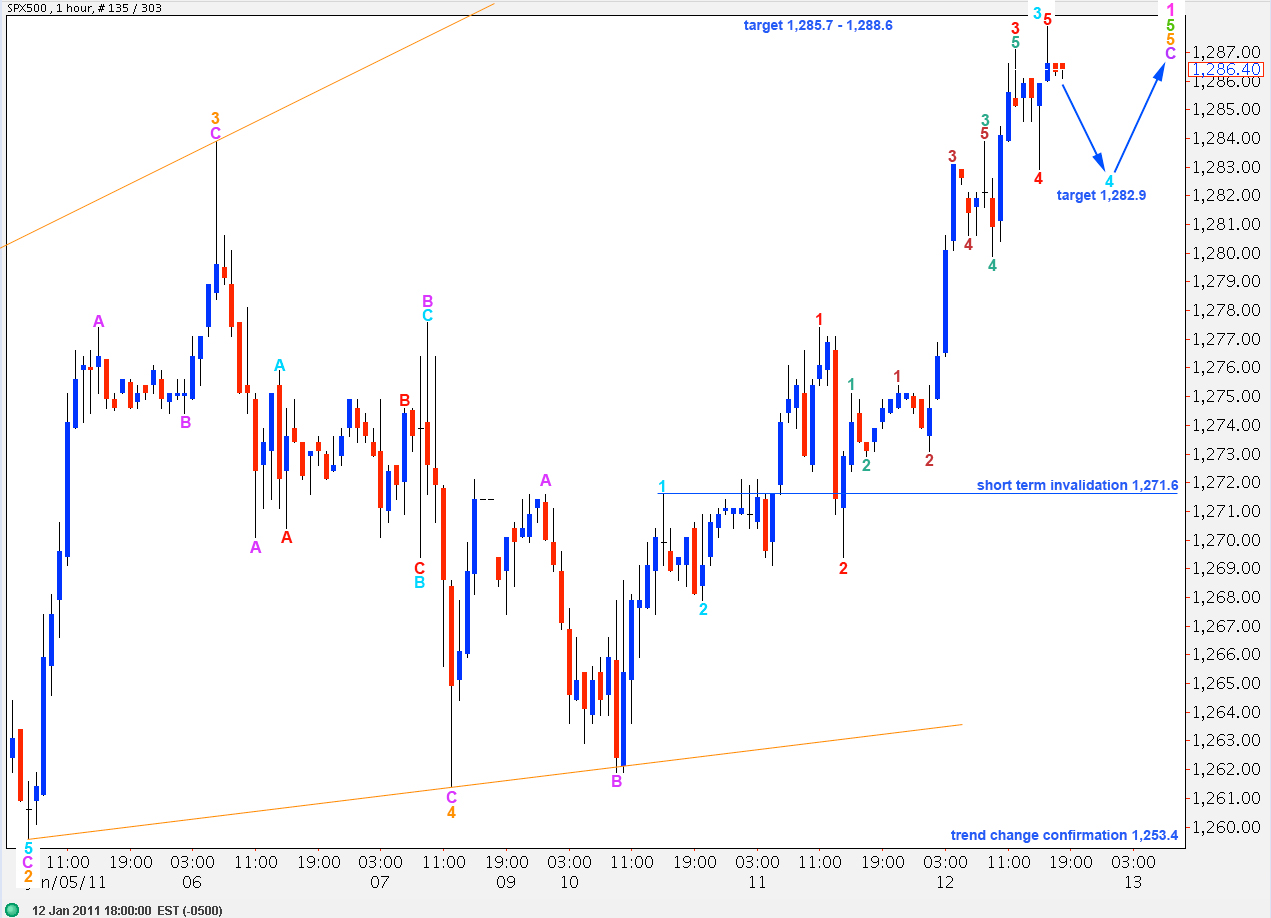
Wave 4 aqua is most likely to correct to about the fourth wave of one lesser degree at 1,282.9. Thereafter, we should see one final upward wave, which may not even show subdivisions on the hourly chart.
Wave 5 aqua to end this movement may be expected to be only 6 points, or less.
We still need to be patient to wait for movement below 1,253.4, however, to confirm a trend change. If we move the labeling of upward movement for wave 5 green all down one degree, then we may only be seeing the end of wave 1 orange within wave 5 green.
Wave 2 cannot move beyond the start of wave 1 below 1,253.4. This is why this price point will provide trend change confirmation.
Lara,
Just curious. In your Dow analysis, you seem to be suggesting that we are very close to the end of P2 (minute (5) of minor 5), whereas your main wave count for the S&P suggests that we are only nearing the end of minute (i) of minor 5.
Wouldn’t both indexes top at approximately the same time?
Peter
Hi Peter,
For the Dow I’ve only presented one daily chart with one degree of labeling, but just like with the S&P I could have produced the other degree of labeling for wave 5 blue with the implication that it is going to continue higher.
For the Dow wave 5 is pretty close to equality with 1 which is very common, that’s why I just presented that one degree of labeling. This would imply that they are both getting ready to turn at primary degree, but I really want us to be very cautious with the S&P about a trend change. If I only present one degree of labeling for the S&P that gives a strong message that I’m calling a high at primary degree and it’s so important that we don’t try to gamble on me being right but wait for confirmation points to be breached.