Elliott Wave chart analysis for the SPX500 for 11th January, 2011. Please click on the charts below to enlarge.
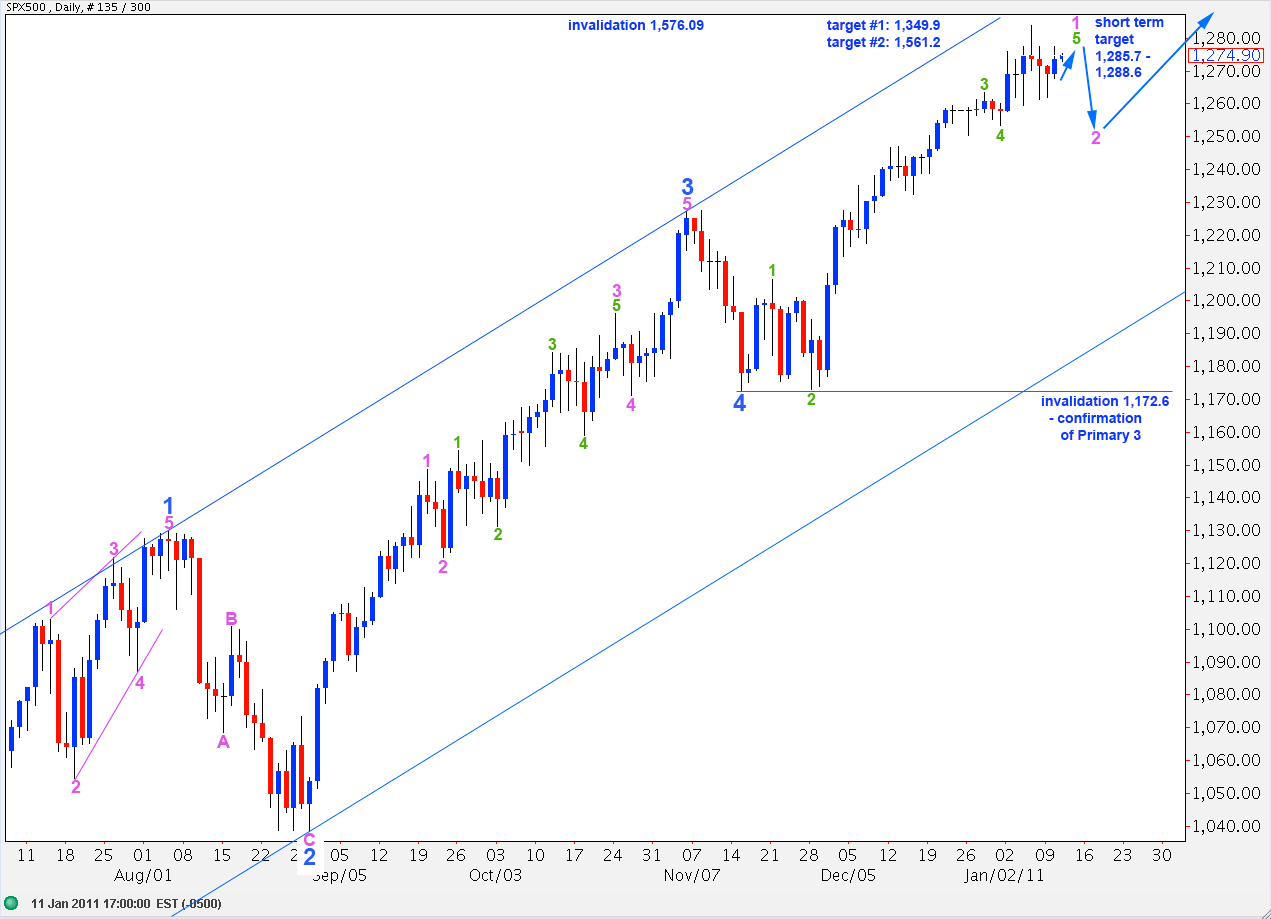
We have seen some upward movement which was overall expected and price remains above the invalidation point on the hourly chart. We still do not have a complete structure to end wave 5 green at this stage and should expect further upward movement to at least 1,285.7 most likely.
When this last small rise is over we should see a trend change which for this wave count is at minute degree. Wave 2 pink may not move beyond the start of wave 1 pink. Therefore, this wave count is invalidated with price movement below 1,172.6.
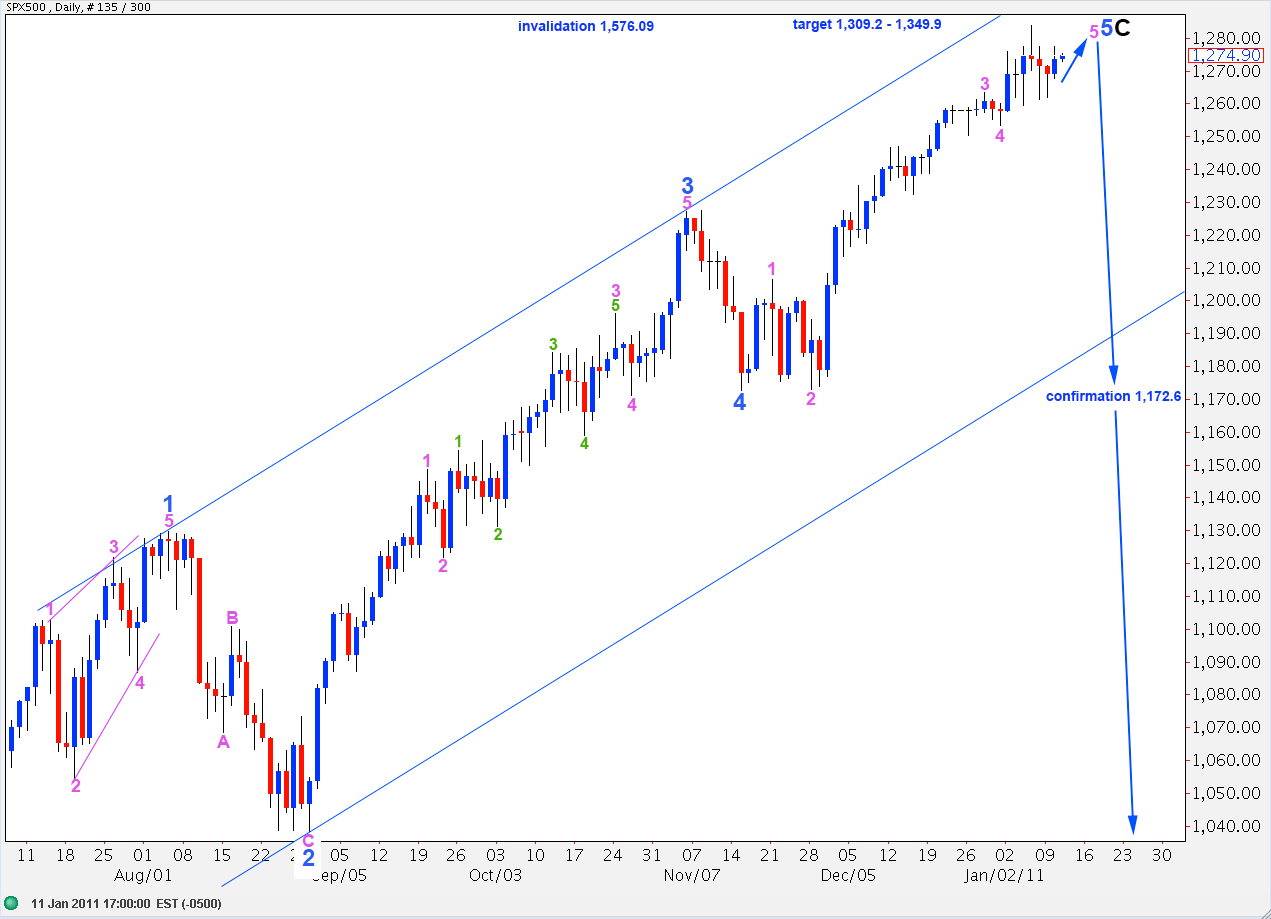
A likely target for wave 5 blue to end wave C black and, therefore, primary wave 2 is at 1,561.2 where wave C black reaches equality with wave A black. This is the most common relationship between waves A and C of a zigzag.
We should not see new highs above 1,576.09 as primary wave 2 may not move beyond the start of primary wave 1.
If we move the labeling for recent movement up one degree then wave 5 blue may be almost at an end.
If this wave count is correct I would expect a longer more drawn out end to this upward trend with a higher level reached.
At 1,309.2 pink wave 5 within blue wave 5 will reach 0.618 the length of pink wave 3. At 1,349.9 wave C black will reach 0.618 the length of wave A black.
When we eventually see the trend change we are expecting, if price moves below 1,172.6, then our first labeling for the daily chart will be invalid and this labeling will be correct. Therefore, movement below 1,172.6 will indicate that primary wave 3 is underway.
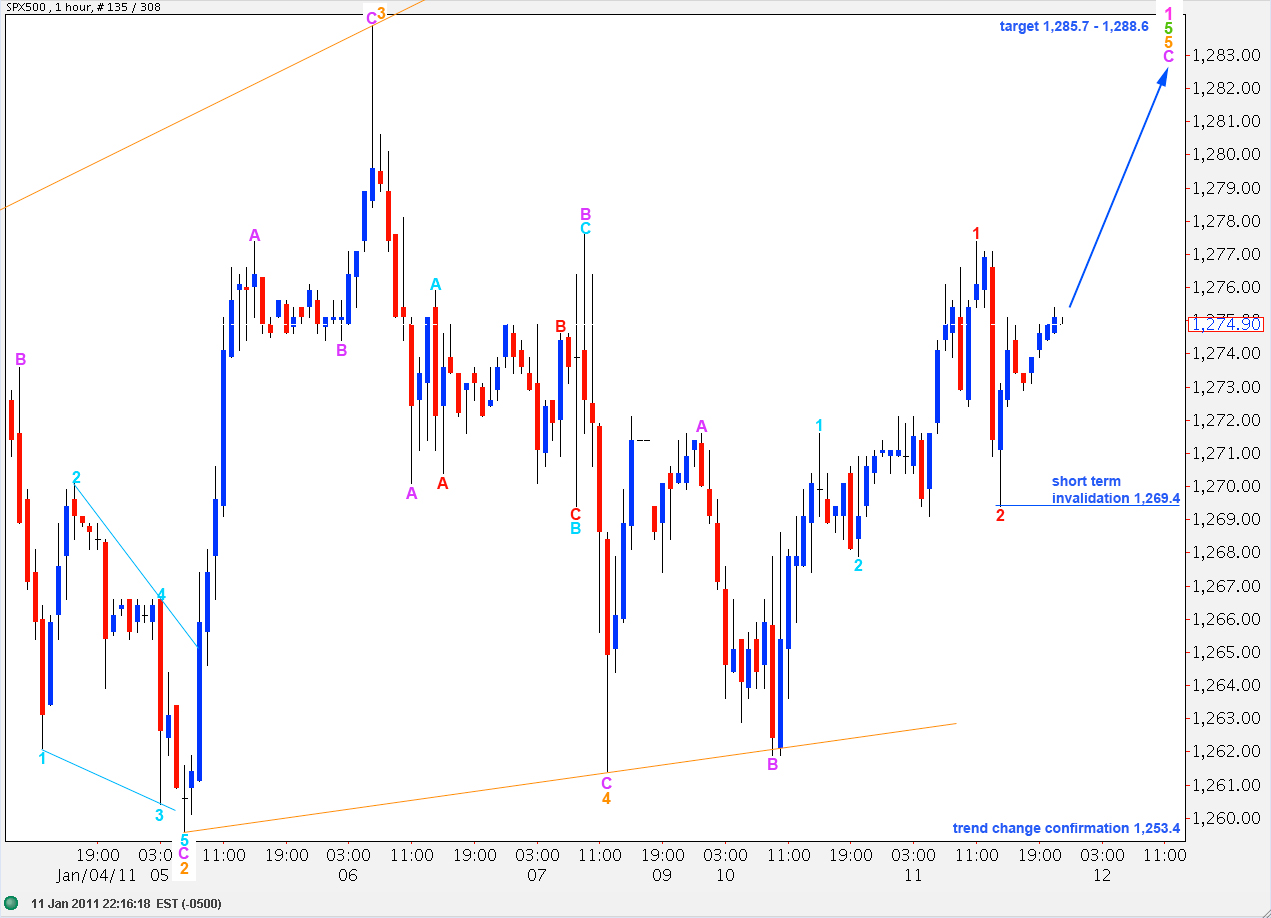
I had expected downward movement for a B wave within wave B purple which did not happen. Therefore, I have adjusted this hourly wave count.
I expect wave A purple ended with a truncated fifth. Thereafter, wave B purple corrected 95% of wave A purple.
We should see continuing upward movement as wave C purple ends this structure.
At 1,285.4 wave 5 orange will reach equality with wave 3 orange. As wave 5 green is an expanding ending diagonal it is highly likely that wave 5 will be longer than wave 3. Therefore, equality between the two should be a minimum expectation (although I have seen expanding diagonals where wave 3 is still the longest).
At 1,287.4 wave 5 green will reach equality with wave 1 green. At 1,288.6 wave C purple within wave 5 orange will reach 2.618 the length of wave A purple.
We should therefore expect upward movement towards this zone.
At this stage movement below 1,269.4 will invalidate my interpretation of most recent movement because any second wave correction within wave 3 red may not move beyond the start of the first.
Only movement below 1,253.4 will indicate a trend change as at that stage downward movement may not be considered an extension of wave 2 orange.


How far down do you expect wave 2 pink to retrace most likely before continuing up if your main wave count holds.
When we have an end to wave 1 pink then we can draw a fibonacci retracement along it and use the fibonacci ratios for targets. As this is a second wave we should expect 0.618 as the most likely target. Until we can do that I’d be using the fourth wave of one lesser degree as the first target, and we need to see price move below here to confirm a trend change anyway.