
Elliott Wave chart analysis for the SPX500 for 28th December, 2010. Please click on the charts below to enlarge.
The S&P has behaved as expected reaching a slightly new high before turning back down for another small correction.
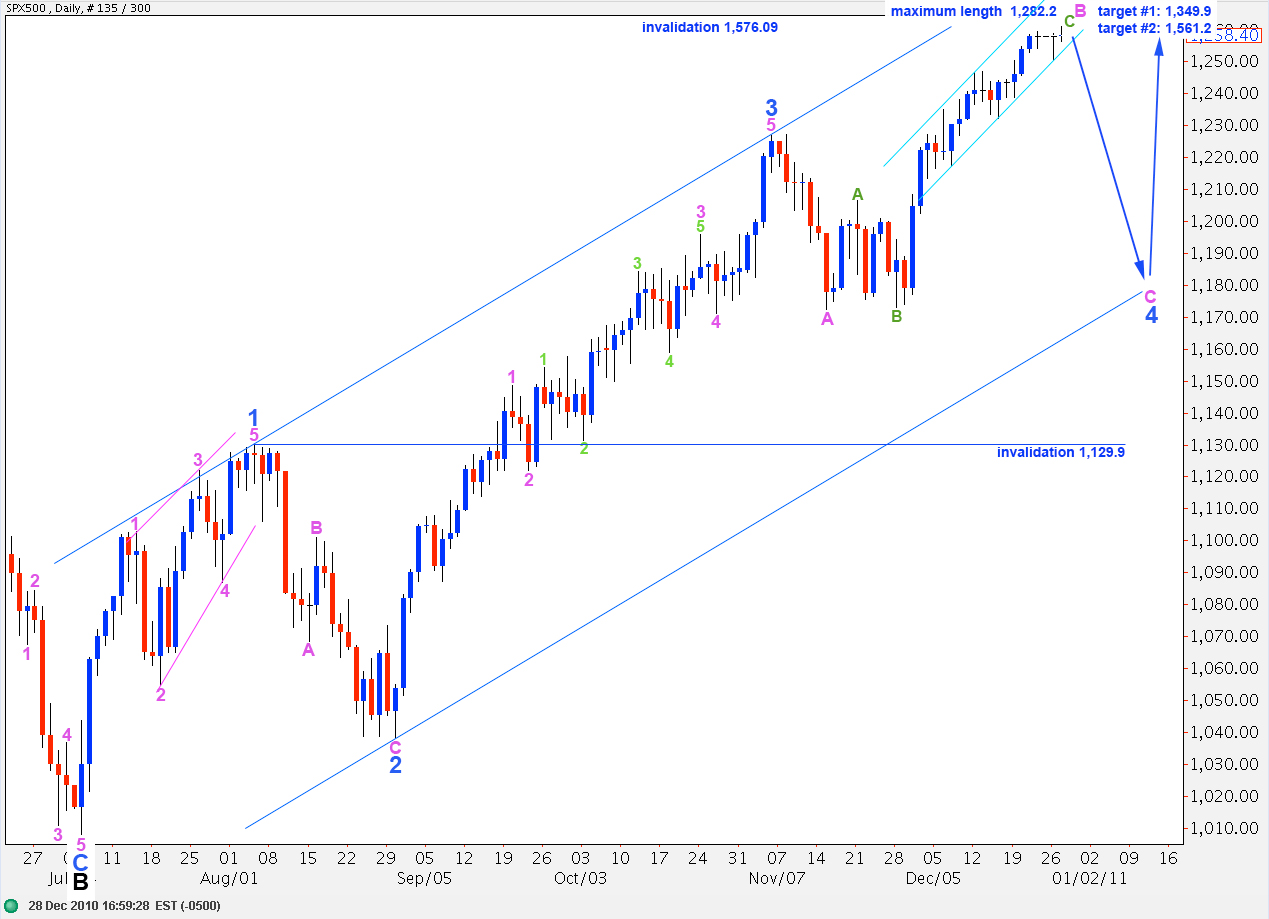
If this wave count is correct then this small correction is the last we shall see before a trend change at minute (pink) degree.
In the long term we may see wave C black end about 1,349.9 where it reaches 0.618 the length of wave A black, or at 1,561.2 where it reaches equality with wave A black. This second target is more likely as equality is the most common relationship between waves A and C within a zigzag.
Upward movement may not move above 1,576.09 as primary wave 2 may not move beyond the end of primary wave 1.
Downward movement for this wave count may not move below 1,129.9 as wave 4 blue may not move into wave 1 blue price territory. If this wave count is invalidated by downward movement then we must consider the possibility that primary wave 2 is over and primary wave 3 is underway.
I have drawn a small trend channel around recent upward movement. This is not Elliott’s technique but it may still work well for us. When this small channel is breached to the downside we may have our first indication of a trend change at minute (pink) degree.
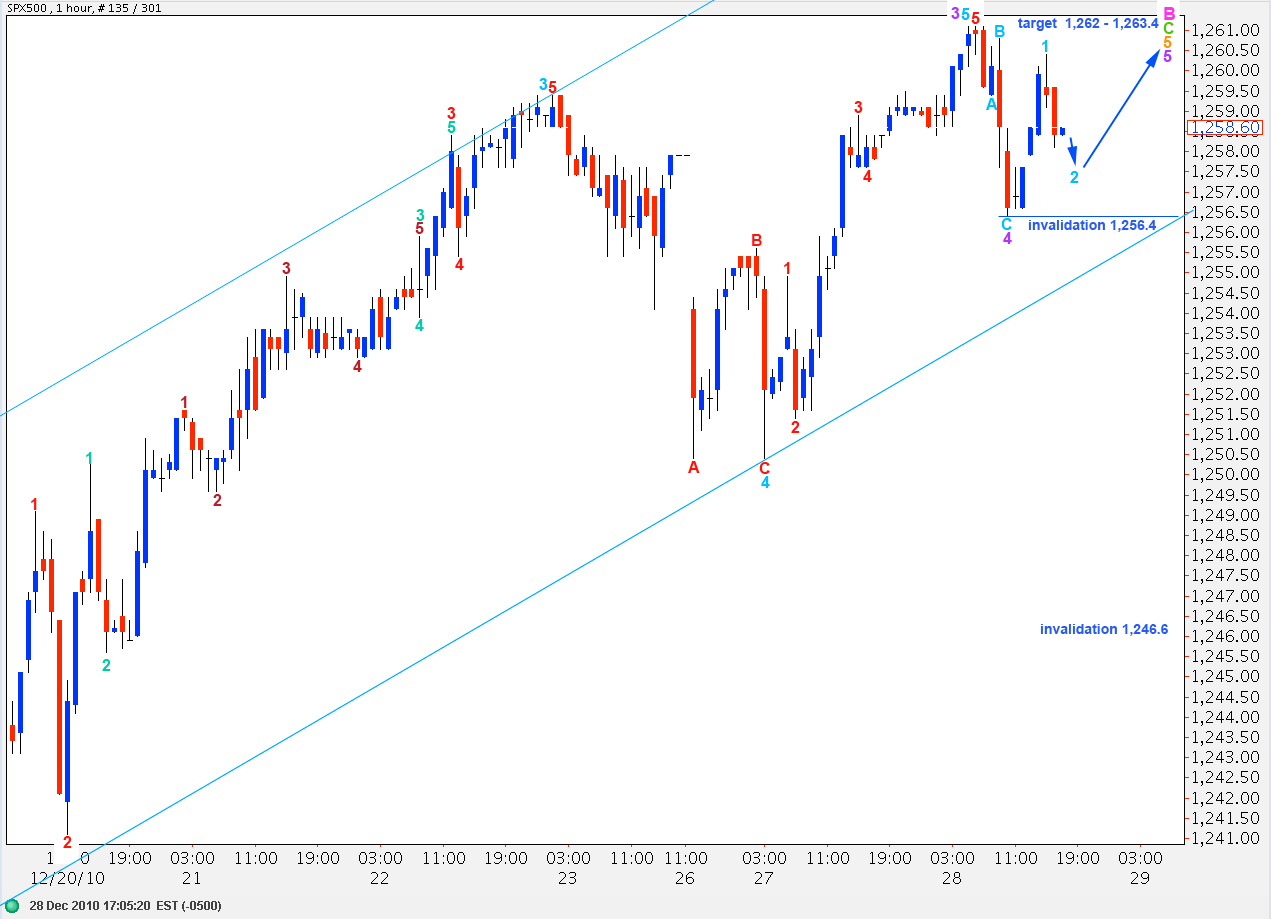
As expected price reached up to 1,261.1, just 0.1 above the target. Thereafter, we can see a three wave structure so far to the downside. This should be a fourth wave correction at purple degree, the last within this fifth wave as the terminal wave of wave C green.
Wave 3 purple just ended is now only 0.3 short of equality with wave 1 purple.
At 1,263.4 wave 5 orange will reach 2.618 the length of wave 1 orange. At 1,262 wave C green will reach 2.618 the length of wave 1 green. This is our target zone for the last upward push to end this trend.
Wave 2 aqua may not move beyond the start of wave 1 aqua within wave 5 purple. Therefore, the short term invalidation point is at 1,256.4.
If wave 4 purple extends any lower it may not move into wave 1 purple price territory below 1,246.6. If this invalidation point is breached to the downside we shall have our first indication that the trend has changed and wave C pink to end wave 4 blue expanded flat correction may then be underway.
Alternate Daily Wave Count.
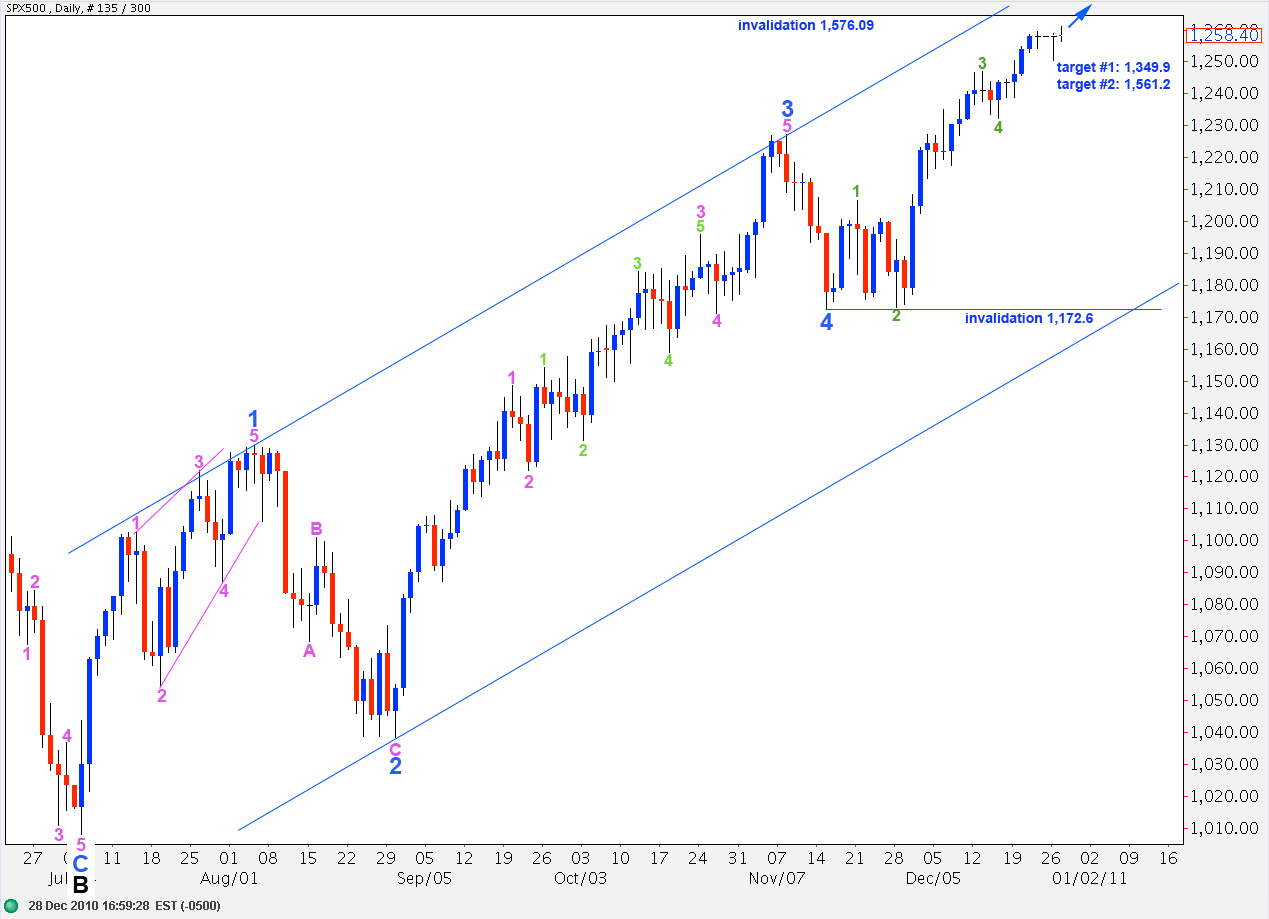
This alternate wave count sees wave 4 blue as brief, only 6 days in duration. It is out of proportion to wave 2 blue and for that reason I do not favour this wave count.
If this wave count is correct then wave 5 blue may be nearing completion, or only wave 1 pink would be nearing completion.
Lara,
I see a wave count between the main and alternate. Is it possible that we are just finishing wave 3 blue (ie, 5 within 3 blue)?
If using the main count, where you have 3 blue around Nov 7, could that point instead be 3 within 3 blue? In other words, where B pink is labled, could this be the end of 3 blue instead?
If so, then 4 blue would be about ready to begin. And, then 5 blue up yet to come.
I bring this up because I’ve been fooled so many times on estimating 3’s to end sooner than they do.
Wave 3’s have that notorious ‘faker’ dropoff as a 4th that I often interpret as the 4th of higher degree. Then, when the higher degree 4th is under way, it becomes more apparent.
Just some thoughts. I always appreciate all you do.
Thanks,
John
Hi John,
Yes that is certainly another alternate possibility. I would consider this more likely than our alternate daily wave count. Our main wave count sees wave C of wave 4 as about to begin, this alternate possibility would see wave 4 in its entirety as about to begin. The expected direction is exactly the same, and the invalidation point would be exactly the same. The difference would be in targets and the expected structure of downwards movement. If downwards movement turns out to be a three and not a five then this alternate would be correct.
I will therefore be keeping this in mind, but because the expected direction does not differ I think it is clearer to not chart and present it alongside our main daily wave count.
Thanks,
Lara