
Elliott Wave chart analysis for the SPX500 for 17th December, 2010. Please click on the charts below to enlarge.
Friday’s session saw sideways movement again from the S&P, this time in a narrower band. We still do not have confirmation of a trend change. However, with each increasing day of sideways movement, we see more candlesticks outside the small green parallel channel containing wave C green to end wave B pink upwards.
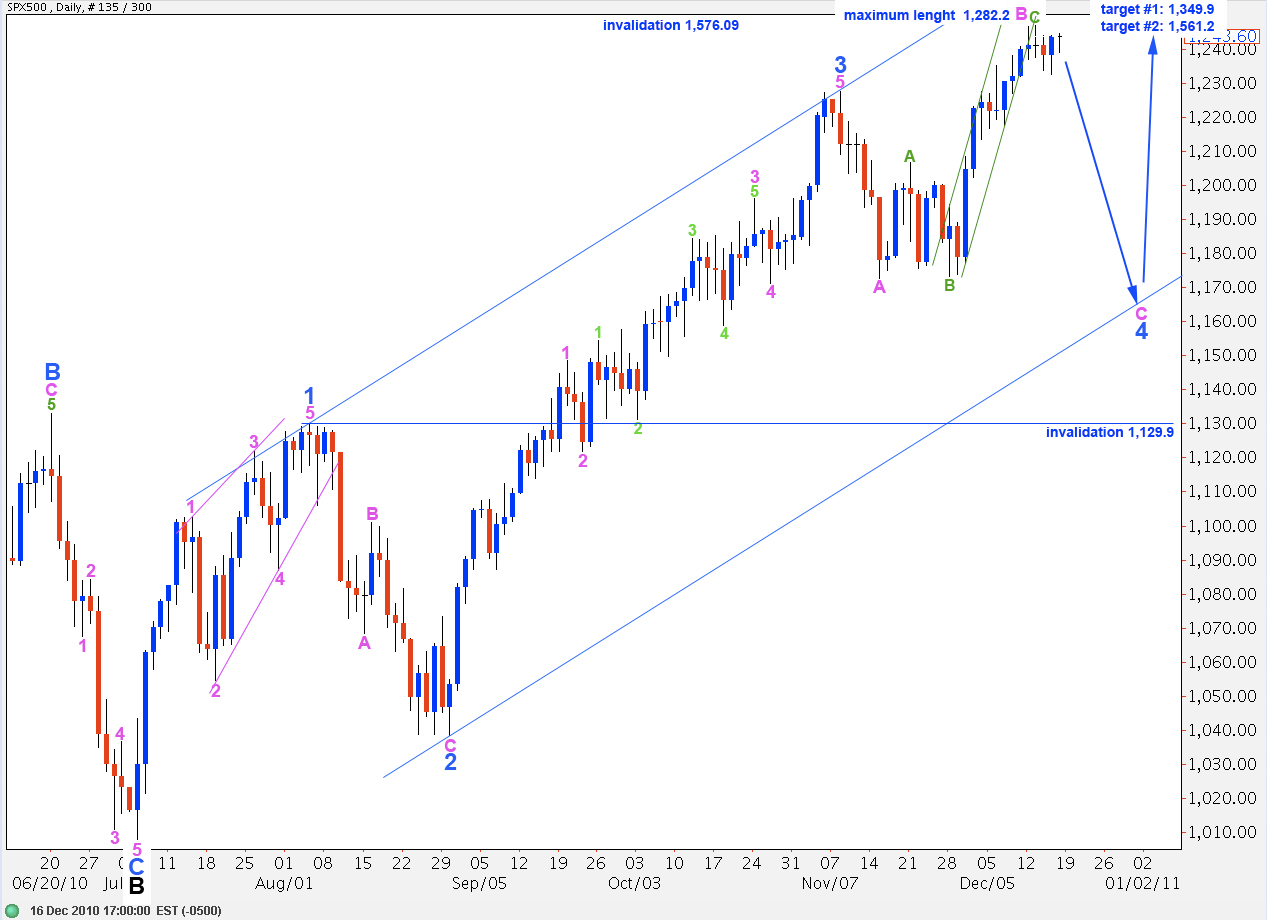
Wave 4 blue should not move into wave 1 blue price territory, below 1,129.9. If this invalidation point is breached we must then consider the possibility that primary wave 2 is over and primary wave 3 is underway. That seems highly unlikely at this stage.
Wave 4 blue is likely to end closer to the lower end of the wide blue parallel channel containing wave C black to the upside.
Thereafter, wave 5 blue will end wave C black to end this zigzag correction for primary wave 2. At 1,349.9 wave C black will reach 0.618 the length of wave A black. At 1,561.2 wave C black will reach equality with wave A black and, because this is the most common relationship between the two, this is the more likely upwards target.
Primary wave 2 may not move beyond the start of primary wave 1. Therefore, we should not see new highs from the S&P above 1,576.09.
When the trend change to the downside for wave C pink is confirmed then we may expect price to continue lower below 1,172.6. Failure of wave C pink to move below the end of A pink would see a truncation and wave 4 blue as a very rare running flat. The rarity of this structure means the likelihood of price moving below 1,172.6 is extremely high.
While price remains below 1,246.6 and above 1,232.1 we will still have two hourly wave counts for this main daily wave count.
Main Hourly Wave Count.
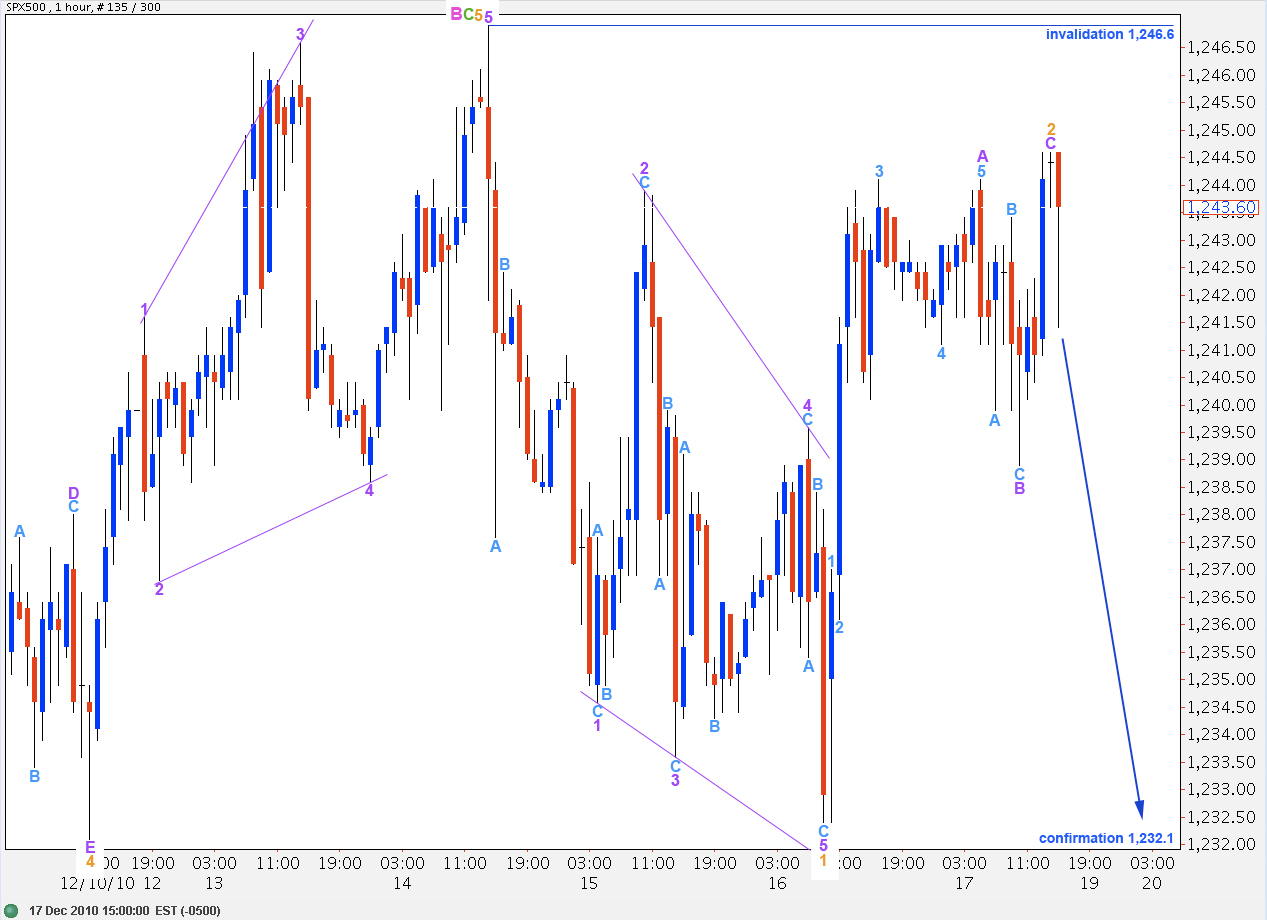
Wave 2 orange has extended higher.
Within wave 2 orange wave C purple is just 1.5 points short of 0.618 the length of wave A purple.
Wave 2 orange may not move beyond the start of wave 1 orange. Therefore, this wave count is invalidated with movement above 1,246.6.
Wave 3 orange must move beyond the end of wave 1 orange. Therefore, this wave count is confirmed with movement below 1,232.4. Movement below 1,232.1 will invalidate the alternate and thereby also confirm this main hourly wave count.
Alternate Hourly Wave Count.
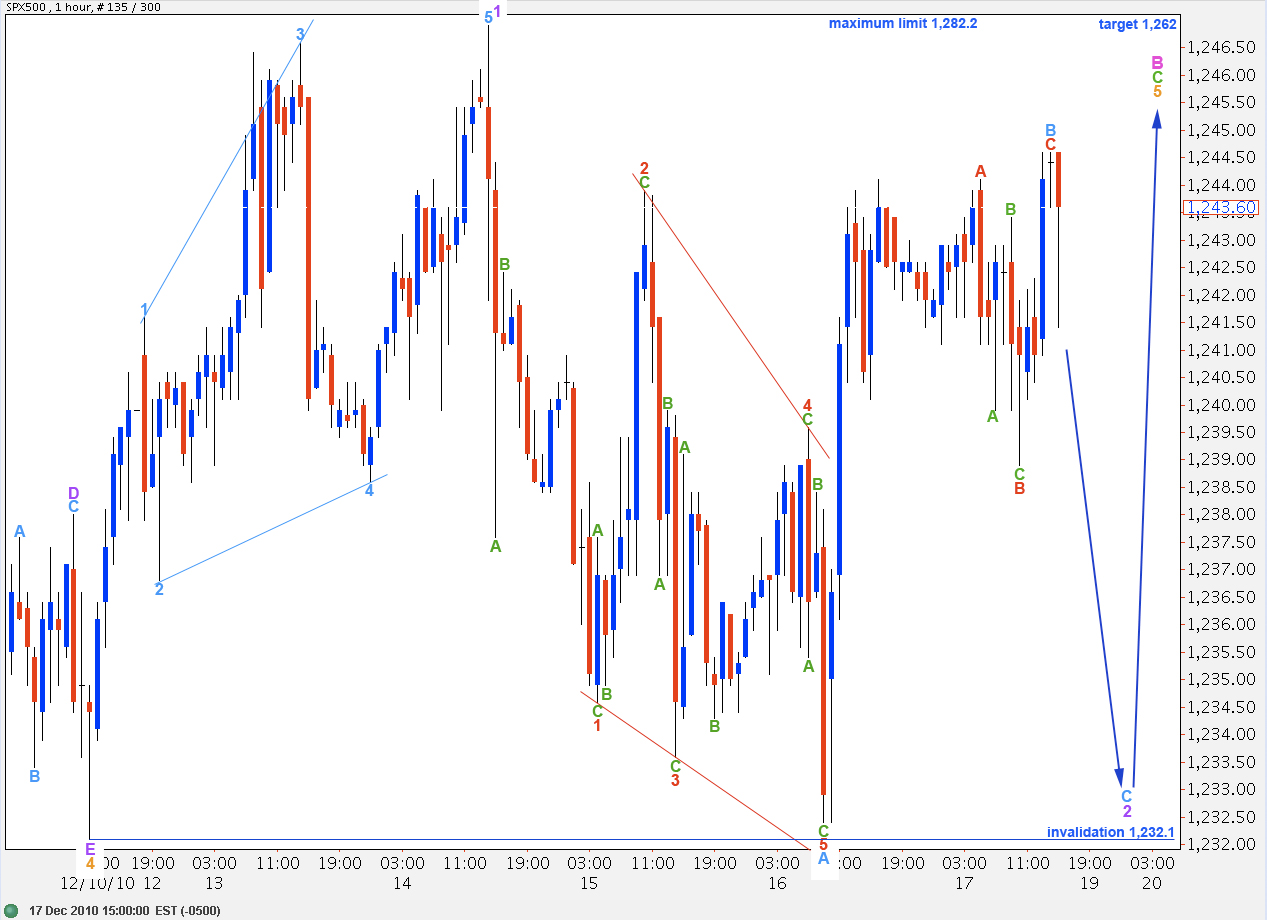
Again the degree of labeling for recent sideways movement is one degree lower here than the main hourly wave count.
This wave count expects a slow drawn out end to wave B pink with further upward movement.
At 1,262 wave C green will reach 2.618 the length of wave A green.
Wave 2 purple may not move beyond the start of wave 1 purple. Therefore, this wave count is invalidated with movement below 1,232.1.
Alternate Daily Wave Count
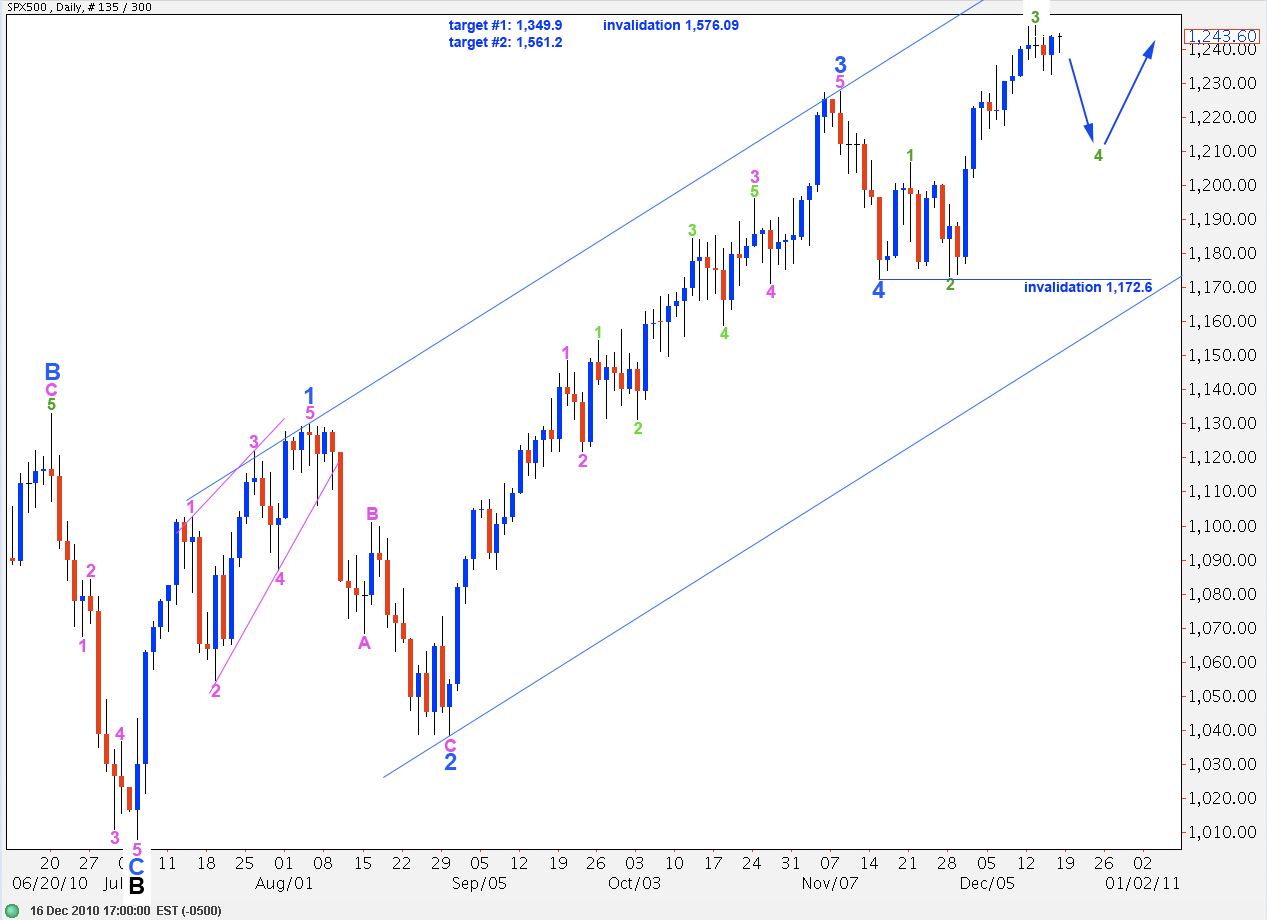
Movement below 1,206.6 would see an end to wave 1 pink and downward movement as wave 2 pink for this wave count, rather than a fourth wave correction within wave 1 pink, as labeled here. This is why I have left the invalidation point at 1,172.6
Movement below 1,172.6 will immediately invalidate this wave count.
This wave count sees wave 4 blue as lasting only 6 days which is out of proportion to wave 2 blue. This seems unlikely.
If this wave count is invalidated with movement below 1,129.9 then it will be likely that primary wave 2 is over and primary wave 3 is underway. At this stage I find this scenario extremely unlikely.
Lara,
Can we use Russell 2000 Small Cap Index as a proxy for S&P500? If so, based on my rudimentary analysis of Russell your Main Hourly Wave Count for S&P500 would have already been invalidated because in Russell the A wave down would have been 37.56 (738.99-701.43). Wave B back up would have already been more then 2x the lenght of wave A running from 701.43 to 779.55.
Thank you,
Mike
wave 5 (or B?) would be just about equal to the presumed Wave 1. Very nice.