
Elliott Wave chart analysis for the SPX500 for 15th December, 2010. Please click on the charts below to enlarge.
The S&P has moved mostly sideways, and slightly lower, remaining above our point of differentiation for our main and alternate hourly wave counts, at 1,232.1. We still do not have confirmation of a trend change and until that happens we should continue to assume that the trend remains up.
We do have a full candlestick outside the lower edge of the small parallel channel containing wave C green to the upside which may be an indication that we have seen a trend change, but it should not be considered confirmation.
We are expecting strong downward movement when wave C pink begins. If price moves below 1,232.1 then the likelihood that it will move strongly lower is increased.
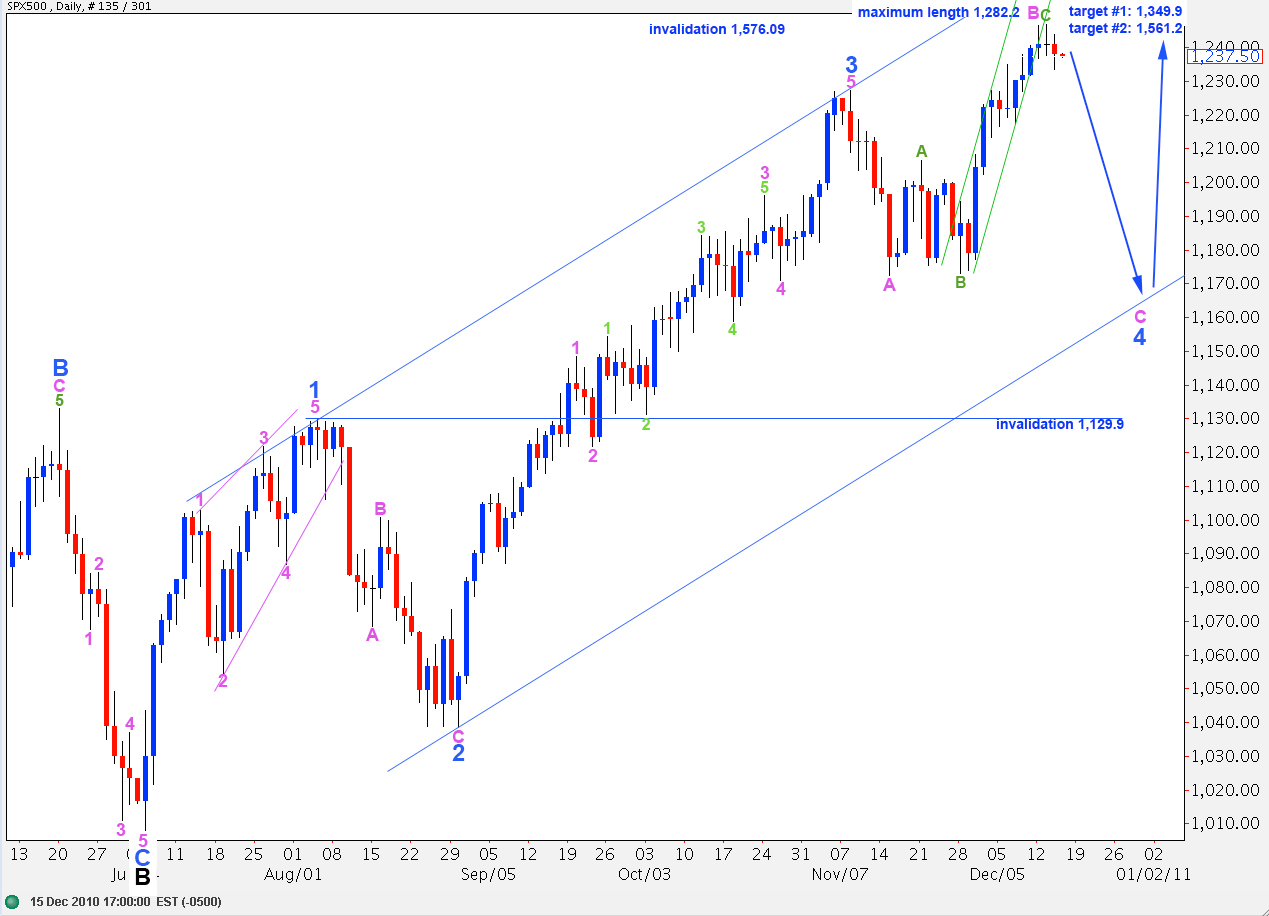
Wave 4 blue should not move into wave 1 blue price territory, below 1,129.9. If this invalidation point is breached we must then consider the possibility that primary wave 2 is over and primary wave 3 is underway. That seems highly unlikely at this stage.
Wave 4 blue is likely to end closer to the lower end of the wide blue parallel channel containing wave C black to the upside.
Main Wave Count.
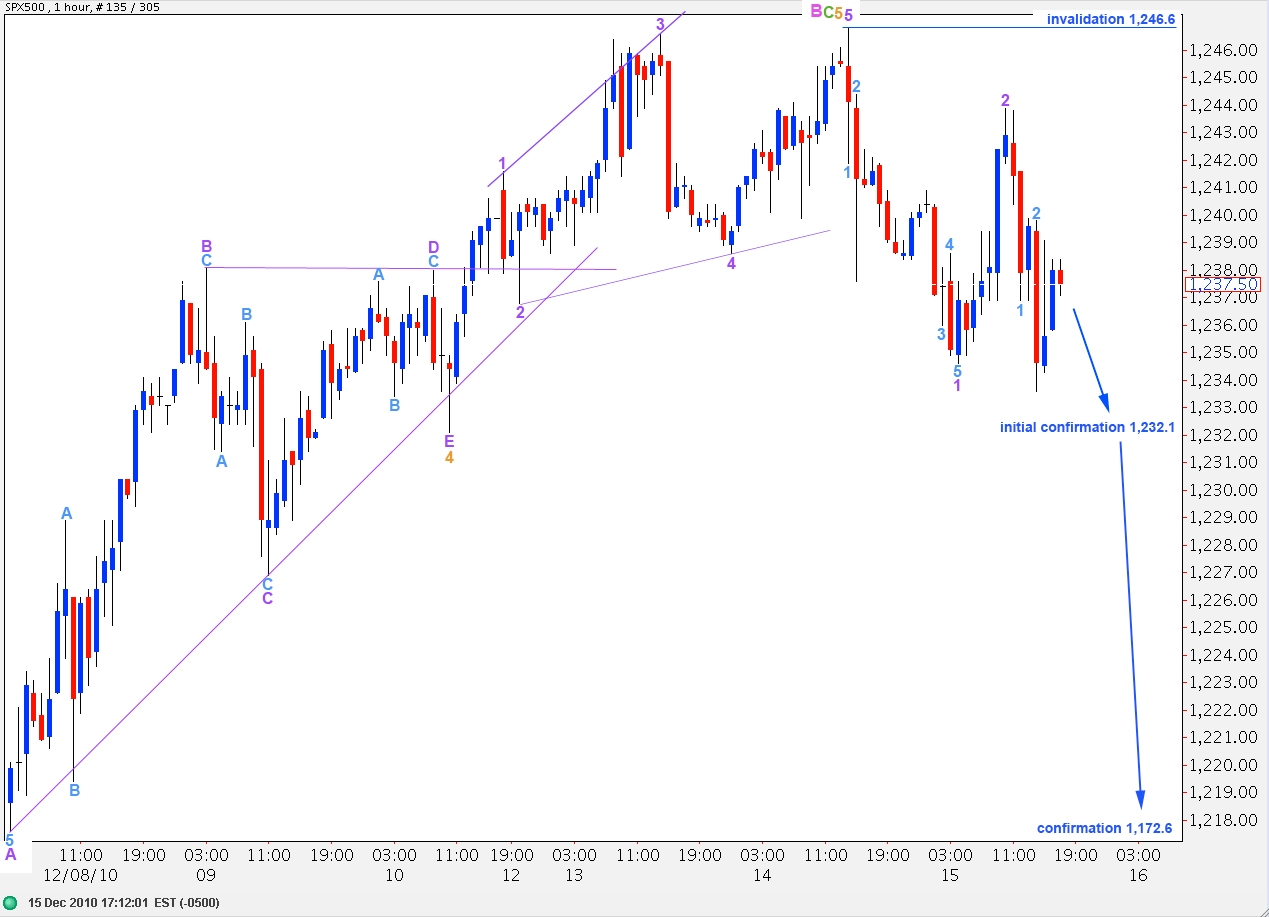
Wave 1 purple down on a 15 minute chart has an impulsive count of 9. Wave 2 up has a corrective count of 7.
If this wave count is correct we should see movement below 1,234.6 as wave 3 purple must move beyond the end of wave 1 purple.
At 1,224 wave 3 purple will reach 1.618 the length of wave 1 purple. This is our short term target. If this wave count is confirmed and this target is reached (thereabouts) we may see a bounce for a fourth wave correction from this point.
Movement above 1,246.6 will invalidate this wave count and validate the alternate below.
Alternate Wave Count.
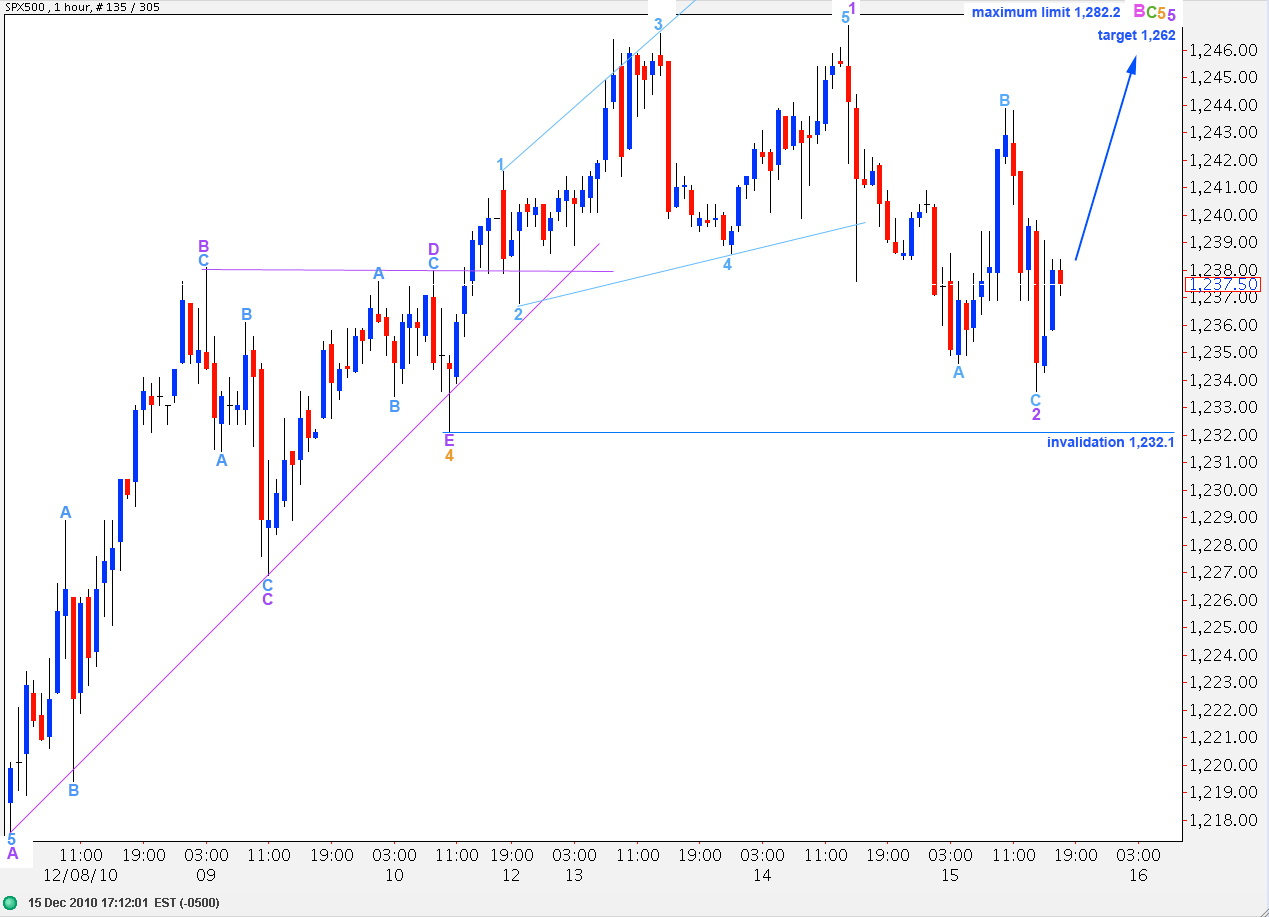
Downward movement may be also seen as a A-B-C as easily as a 1-2-3.
If this wave count is correct then we should not see movement below 1,232.1 as wave 2 purple may not move beyond the start of wave 1 purple.
If price moves above 1,246.9 this wave count may be confirmed. At that stage we should expect a continuance of a long drawn out slow rise towards the target 1,262, where wave C green will reach 2.618 the length of wave A green within wave B pink.
Alternate Daily Wave Count.
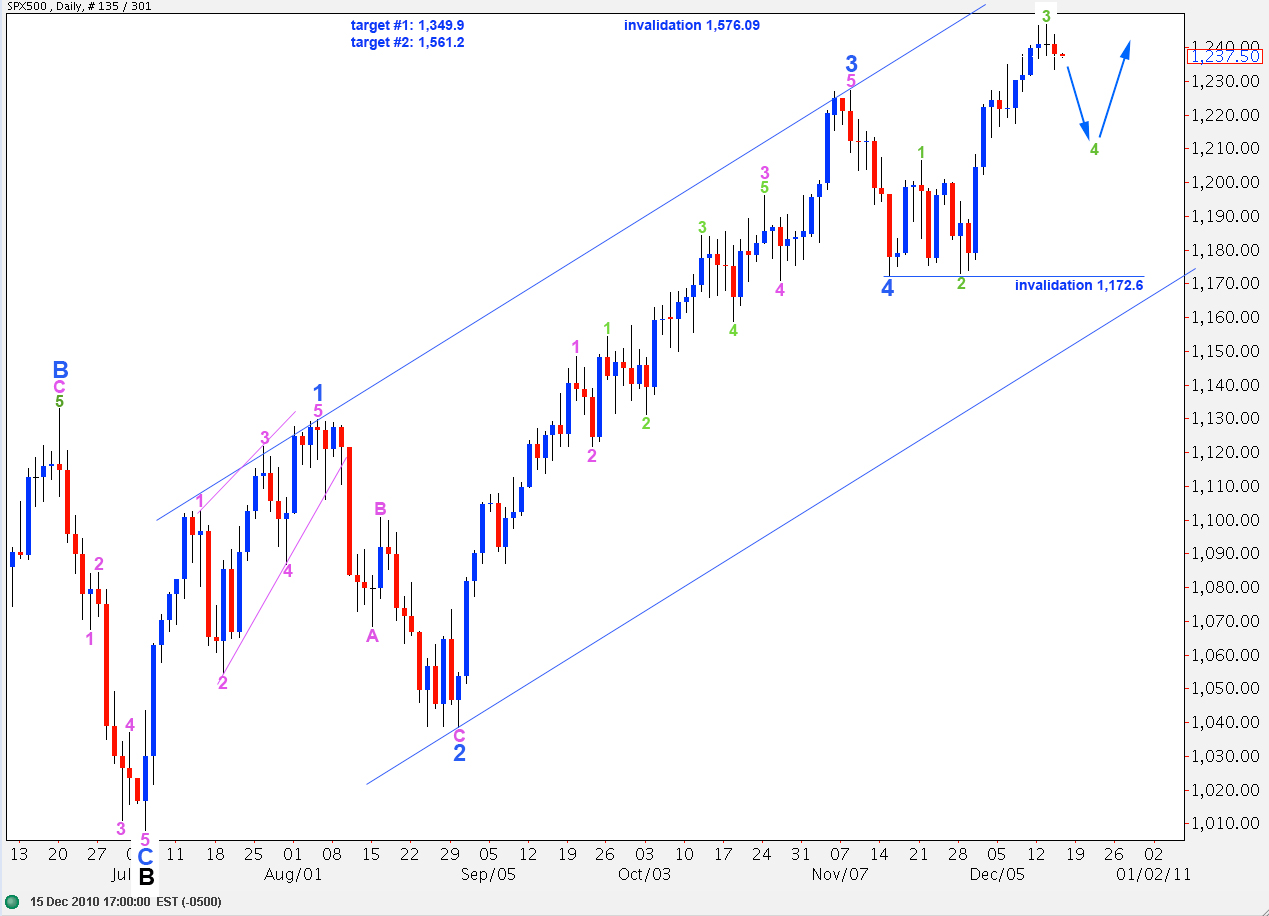
This wave count remains technically correct but it does not have a good look on the daily chart.
Movement below 1,206.6 would see an end to wave 1 pink and downward movement as wave 2 pink for this wave count, rather than a fourth wave correction within wave 1 pink, as labeled here.
Movement below 1.172.6 will immediately invalidate this wave count.
Hi Lara-It is interesting to note that if we were to consider Wave C of PW2 complete, Wave 4, although much shallower than Wave 2, would nevertheless be equal to Wave 2 in time duration. ( BTW, these are oddly somewhat consistent duration wise with W2 & W4 of PWA). In addition, Wave 5 of C would be 61.8% the length of Wave 1 of C which, coincidently, is the same relationship held by that of Wave 5 and Wave 1 of PWA .
This is not to say that W5 of Wave C of PW2 is over but that the relationships are not totally inconsistent with what has come before. It would be nice to see some fibonacci relationship between Wave A and Wave C of PW2 and I suspect that before the dust settles on PW2 there will be.
Thank you.
Robert
Robert
Hi Robert, that’s not what I’ve labeled. If wave 4 blue ended at 1,172.6 then it was only 6 days in duration (my alternate daily wave count at the end of analysis), wave 2 blue was 19 days in duration, quite a big difference and one reason why I don’t think 4 blue ended there. If 4 blue was over with a slightly truncated C within it at 1,173.1 then it lasted 15 days, still a few short of wave 2 in duration. My problem with that idea is that within 4 blue wave B pink would have a truncated C (most likely) or wave C pink looks like a three (highly unlikely). It has a horrible look overall.