
Elliott Wave chart analysis for the SPX500 for 14th December, 2010. Please click on the charts below to enlarge.
The S&P has moved very slightly higher with mostly sideways movement for the last 24 hours.
We still have two wave counts at both daily chart and hourly chart levels today. The point of differentiation between the daily alternate wave counts is 1,172.6; movement below this point will confirm the main daily wave count. The point of differentiation between the main and alternate hourly wave counts is 1,232.1; movement below this point will confirm our main wave count.
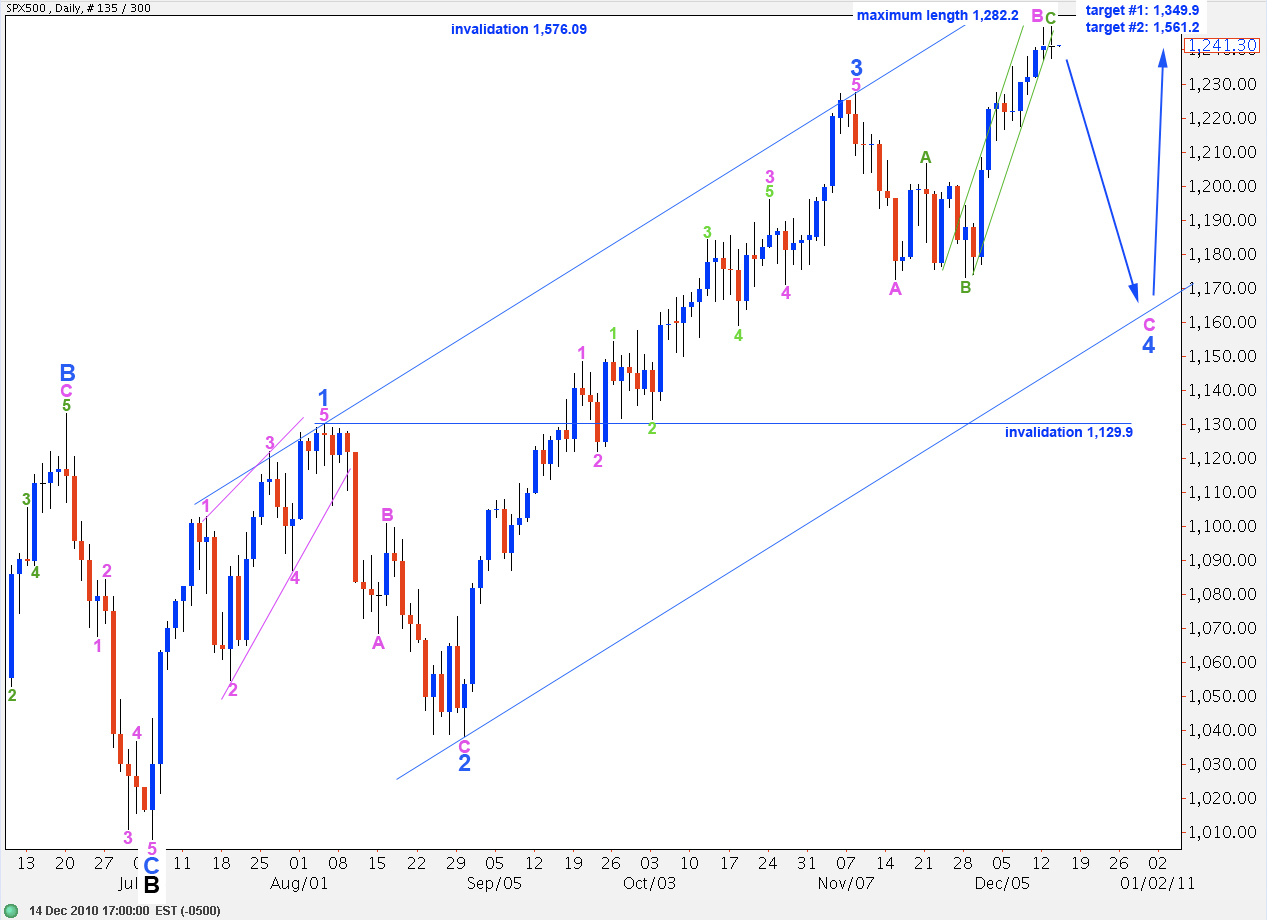
This main daily wave count expects wave B pink is either over or may continue upward to a target of 1,262. It is most likely that it was over in yesterday’s session, but as before, we should expect that the trend remains up until proved otherwise.
This wave count expects downward movement for a C wave at minute degree to end this expanded flat correction for wave 4 blue.
Wave 4 blue may not move into wave 1 blue price territory, below 1,129.9. If we see price move below this point then we must consider the extremely slim possibility (at this stage) that primary wave 2 is over and primary wave 3 is underway.
Main Hourly Wave Count.
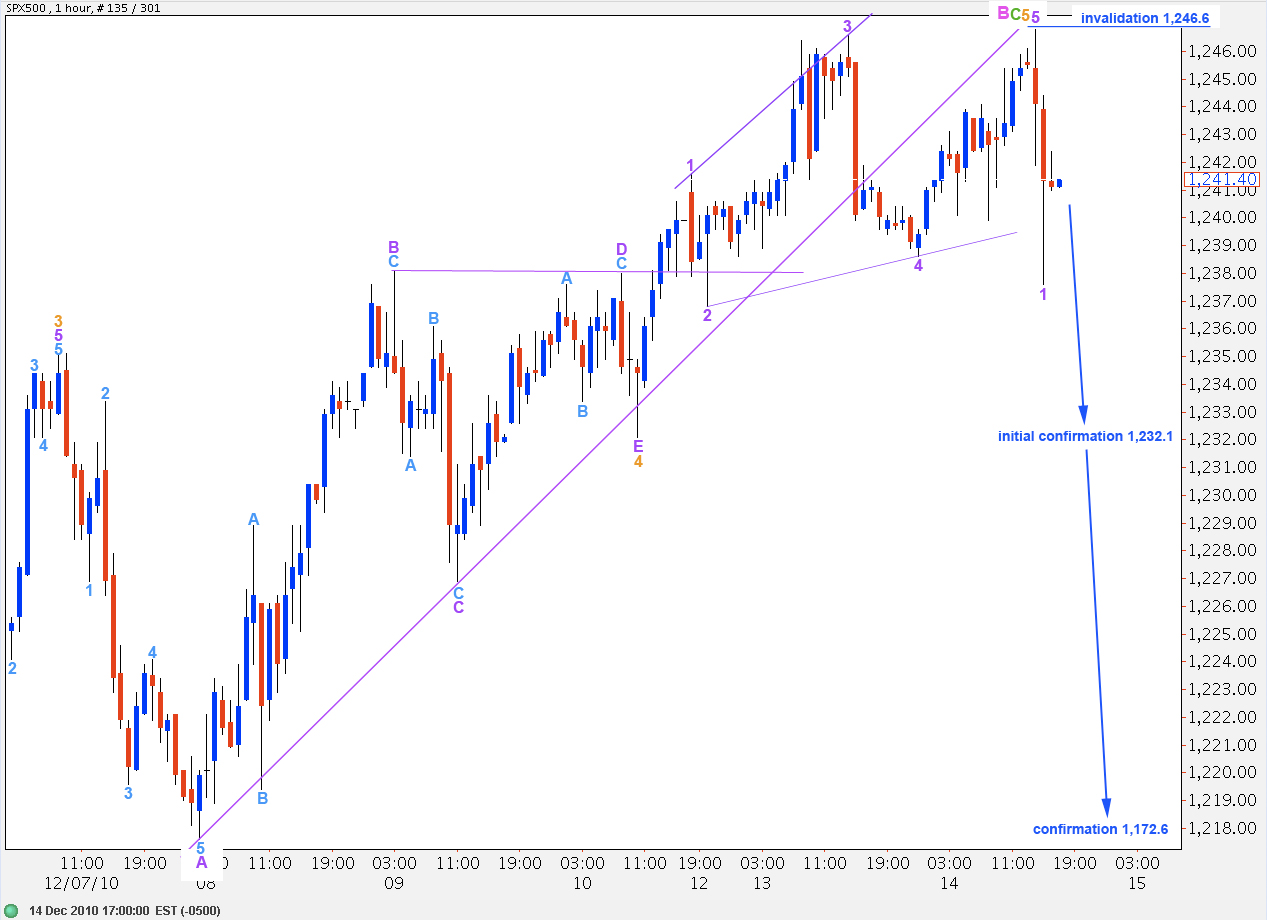
With an adjustment to labeling of wave 5 orange ending expanding diagonal, after yesterday’s sideways movement, this structure now has a much more satisfactory look than yesterday’s analysis.
Wave 3 purple of this diagonal is the longest but all other rules and guidelines for this structure are met.
Movement below 1,232.1 will provide initial confirmation of this wave count. Movement below 1,172.6 will provide final confirmation of pink wave C being underway.
Alternate Hourly Wave Count.
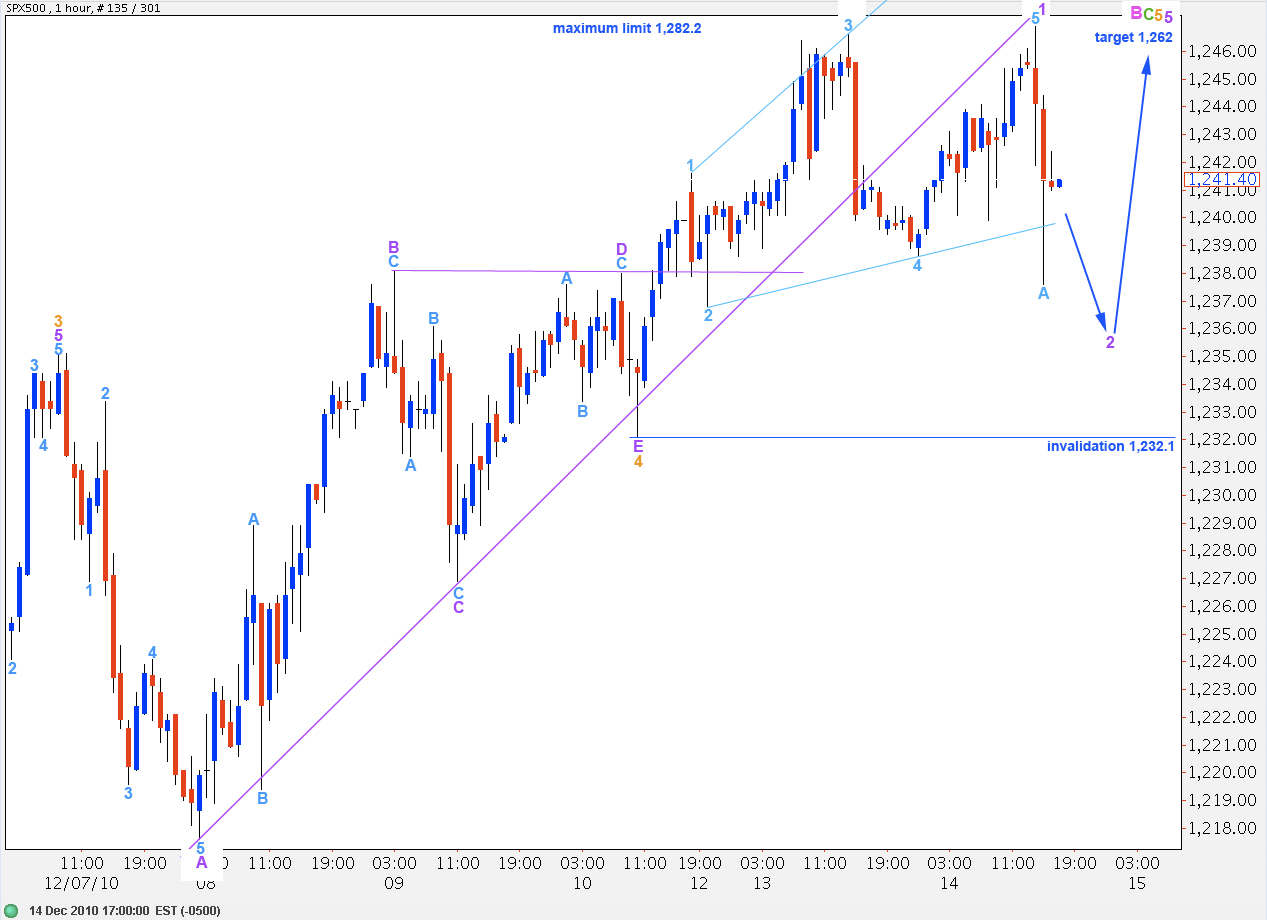
As with yesterday’s analysis this wave count is exactly the same as the main hourly wave count, with the exception of the degree of labeling for this last movement.
Movement below 1,232.1 will invalidate this wave count.
We should expect wave 2 purple to extend further downward; it looks incomplete at this point.
At 1,262 wave C green to end wave B pink zigzag will reach 2.618 the length of wave A green.
Alternate Daily Wave Count.
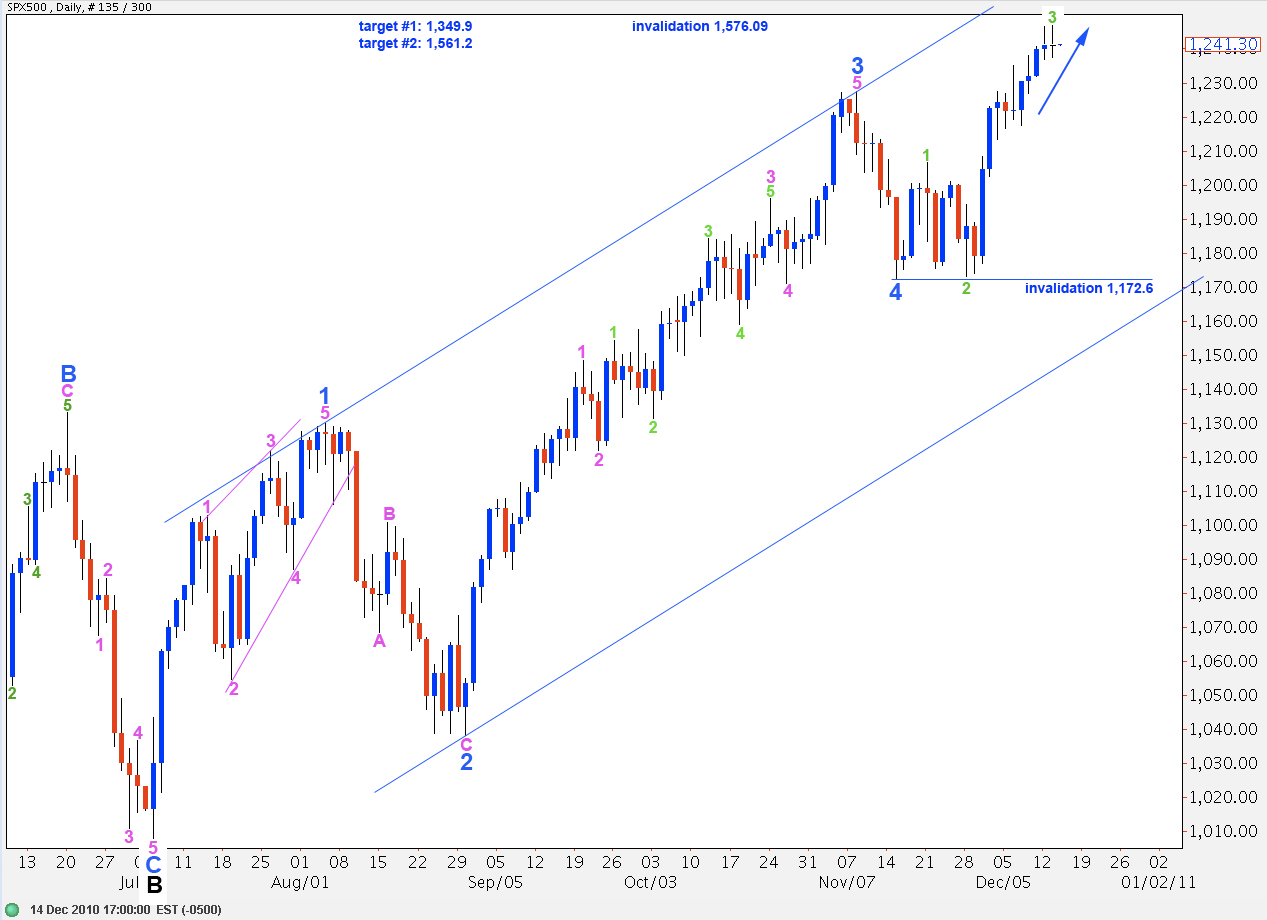
This wave count remains valid. Continued upward movement will make this wave count seem more likely.
At this stage I consider this alternate wave count unlikely. We should expect wave 4 blue to be a clearer and stronger downside correction on the daily chart. It is more likely that it may come closer to the lower edge of the wide blue parallel channel drawn here about wave C black.
Movement below 1,172.6 would invalidate this wave count.
I’ve been out of town for about seven weeks and see that you have a different count. If I may ask what is the large picture count at this time. Is this a wave 1 up to 1300/1500 of a five wave bull market sequence. Sorry just out of the loop and need to see where we are at this point. Thanks. Bob
Welcome back Bob. I’ve updated the historical analysis big picture: http://elliottwavestockmarket.com/category/spx500-historical-analysis/
We’re still in primary 2 mid term. Primary 3 yet to start. Short term we’re expecting a minute C wave down to end minor 4 correction within this intermediate C wave to end primary 2.