
Elliott Wave chart analysis for the SPX500 for 10th December, 2010. Please click on the charts below to enlarge.
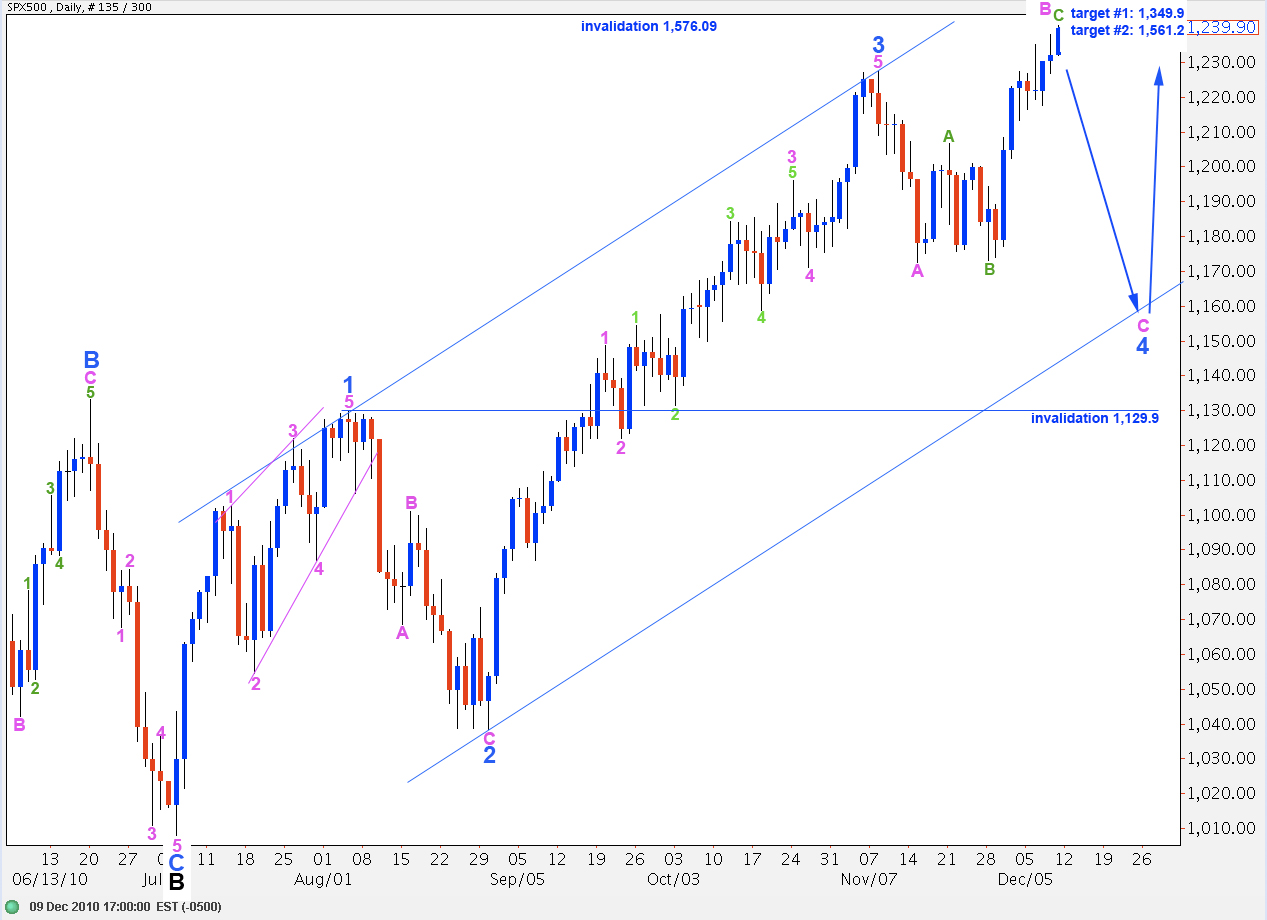
We may have seen an end to this fourth wave triangle. The S&P may be completing the final fifth wave to the upside before turning back down for wave C pink to end wave 4 blue.
When we have a known end for wave B pink then we may calculate a target for wave C pink.
Wave 4 blue may not move into wave 1 blue price territory. Therefore, this upcoming C wave at pink degree may not move below 1,129.9.
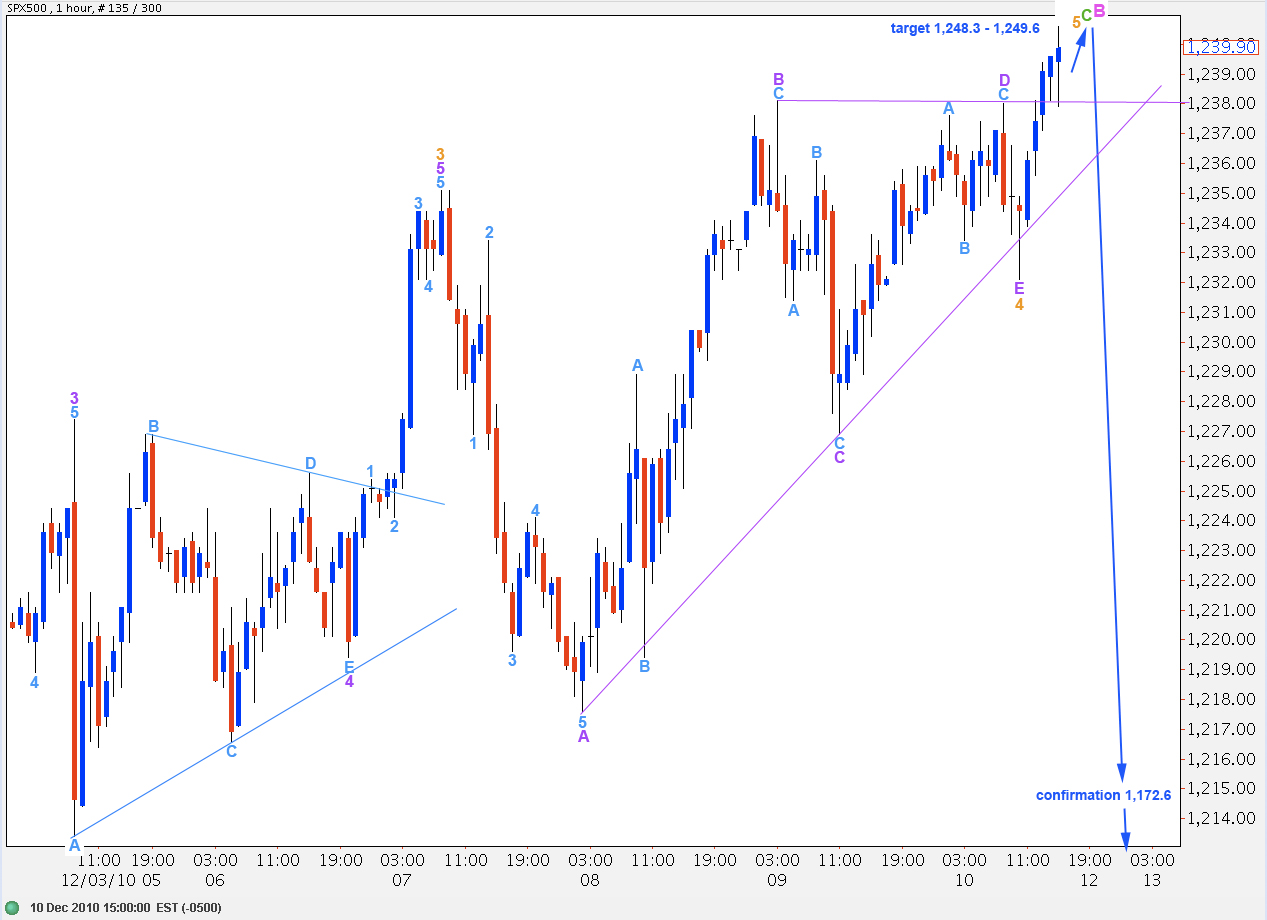
We may have already seen an end to this fourth wave correction for wave 4 orange, as a barrier triangle.
If this is correct then we should expect a fifth wave upward thrust out of the triangle. If wave 5 orange reaches equality with wave 1 orange our upside target is 1,249.6.
Wave B pink in its entirety will reach 138% of wave A pink at 1,248.33.
Alternately, it is possible that so far upward movement is only wave B purple of the triangle, but this looks fairly unlikely. Upward movement from the point labeled E purple looks exactly like a fifth wave should.
When this fifth wave at orange degree is over we should expect a trend change to the downside for the next couple of weeks for a C wave at pink degree.
Alternate Wave Count.
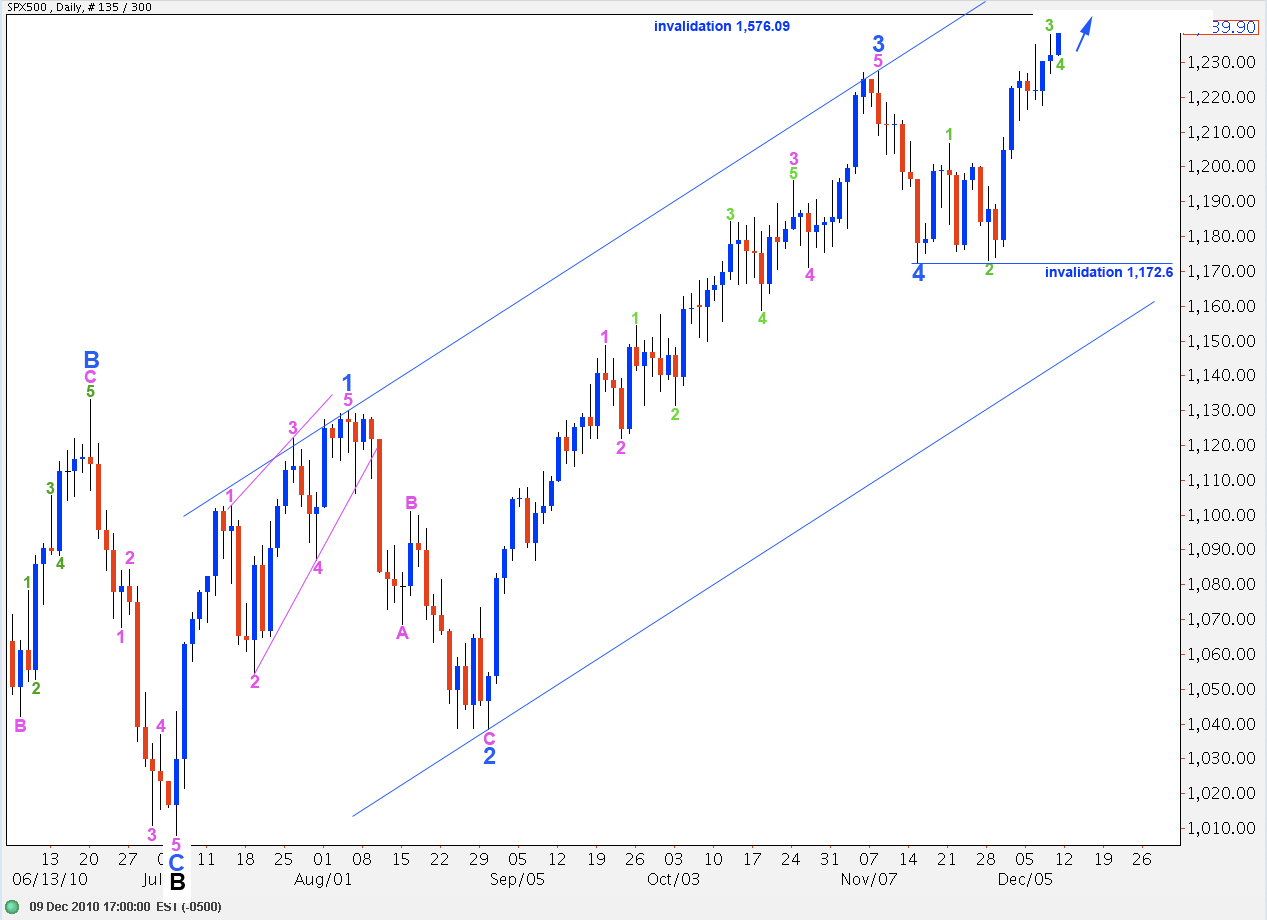
At the hourly chart level this wave count is exactly the same as the main and expects further upward movement next.
Any further extension of wave 4 green may not move into wave 1 green price territory. Therefore, in the short term we should not see price move below 1,206.6 for this wave count.
When wave 5 green is over, and it has already met minimum technical requirements, then this wave count will expect downward movement for a second wave correction at pink degree, which may not move beyond the start of wave 1 pink below 1,172.6.
Sorry. If this is W5 it is nearing 61.8% of W1.
Hi Lara-Although suspicious, and somewhat skeptical, I am starting to suspect that EWI might be onto something as the evidence rapidly continues to mount. We are nearing 61.8% of W1 of W2. All indicators are diverging or are terribly oversold. This is starting to look like W5 ending. Look at RSI weekly and we see 5 waves up. If this is W5 it would show divergence to W3 in daily RSI which it does. We could ignore the momentum indicators if we had internal strength of trend but we do not. If this does not reverse in a big way it will be something of a conundrum.
Thank you. Robert
Hi Robert – I’m not following EWI’s analysis any more. But I’m not surprised to hear they’re again calling an end to primary 2. I’m not going to give their reasons any weight whatsoever again, I’m just going to continue to live in my own little bubble and do my own analysis.
I’ve been put off so much by EWI’s counts and analysis in the past; if I had never looked at their bigger picture for the Dow or S&P I would hope that I would have seen that five wave up structure that I now have as intermediate A as just that, an A wave, and not the triple zigzag that they called it. I’ll never know if I would have got it right, or not, but at least I can refrain from repeating the same mistake by avoiding their analysis.
So to conclude, I really would be expecting this intermediate wave C to have a very clear five wave structure on the daily chart, and at this stage I don’t think it has. So I think it has further up to go yet. And I’ll still favour the upper target of 1,561.2 simply because that is the most common relationship between A and C of a zigzag therefore this tells us that that is the most likely ending point for C.
I may be wrong but at least I’ll only have myself to blame 🙂