
Elliott Wave chart analysis for the SPX500 for 8th December, 2010. Please click on the charts below to enlarge.
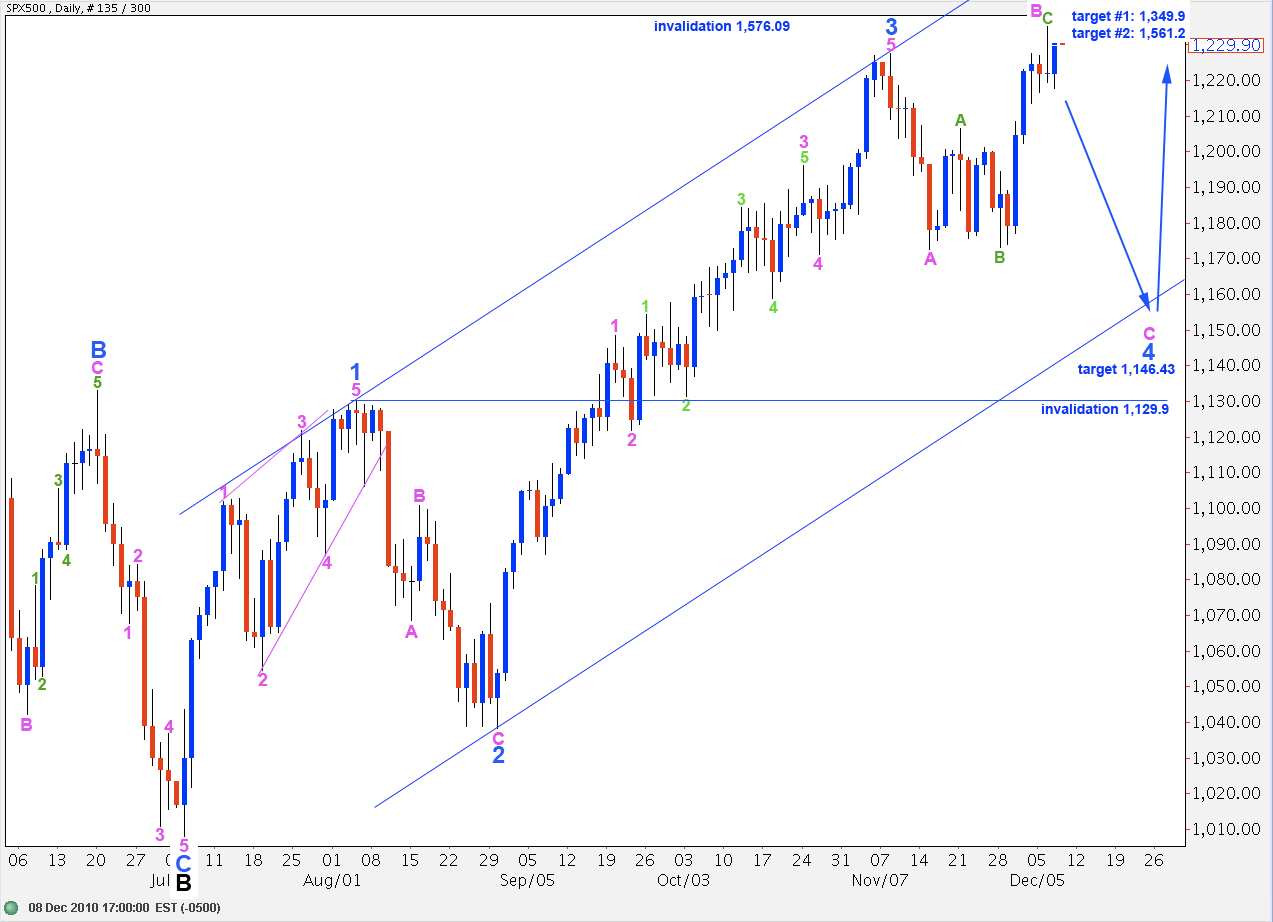
The S&P is within a C wave at pink (minute) degree to the downside for a fourth wave correction at blue (minor) degree.
Wave 4 blue is an expanded flat correction, because wave B within it was a 114% correction of wave A pink.
We should expect a C wave at pink degree which ends substantially beyond the end of wave A pink, below 1,172.6. Because failure of wave C to move below this point would see this fourth wave structure as an extremely rare running flat correction, we may expect that the likelihood of price falling below this point in the near future is extremely high.
At 1,146.43 wave C pink to end wave 4 blue will reach 1.618 the length of wave A pink. This is the most common relationship between waves A and C within an expanded flat correction. Therefore, the likelihood of price reaching to this point is fairly high.
Wave 4 blue may not move into wave 1 blue price territory. Therefore, we should not see price move below 1,129.9.
Long term targets for wave C black to end primary wave 2 remain the same. At 1,349.9 wave C black will reach 0.618 the length of wave A black and at 1,561.2 wave C black will reach equality with wave A black. I favour the upper target as this is the most common relationship between waves A and C of a zigzag.
Price may not reach above 1,576.09 to a new high as primary 2 may not move beyond the start of primary 1.
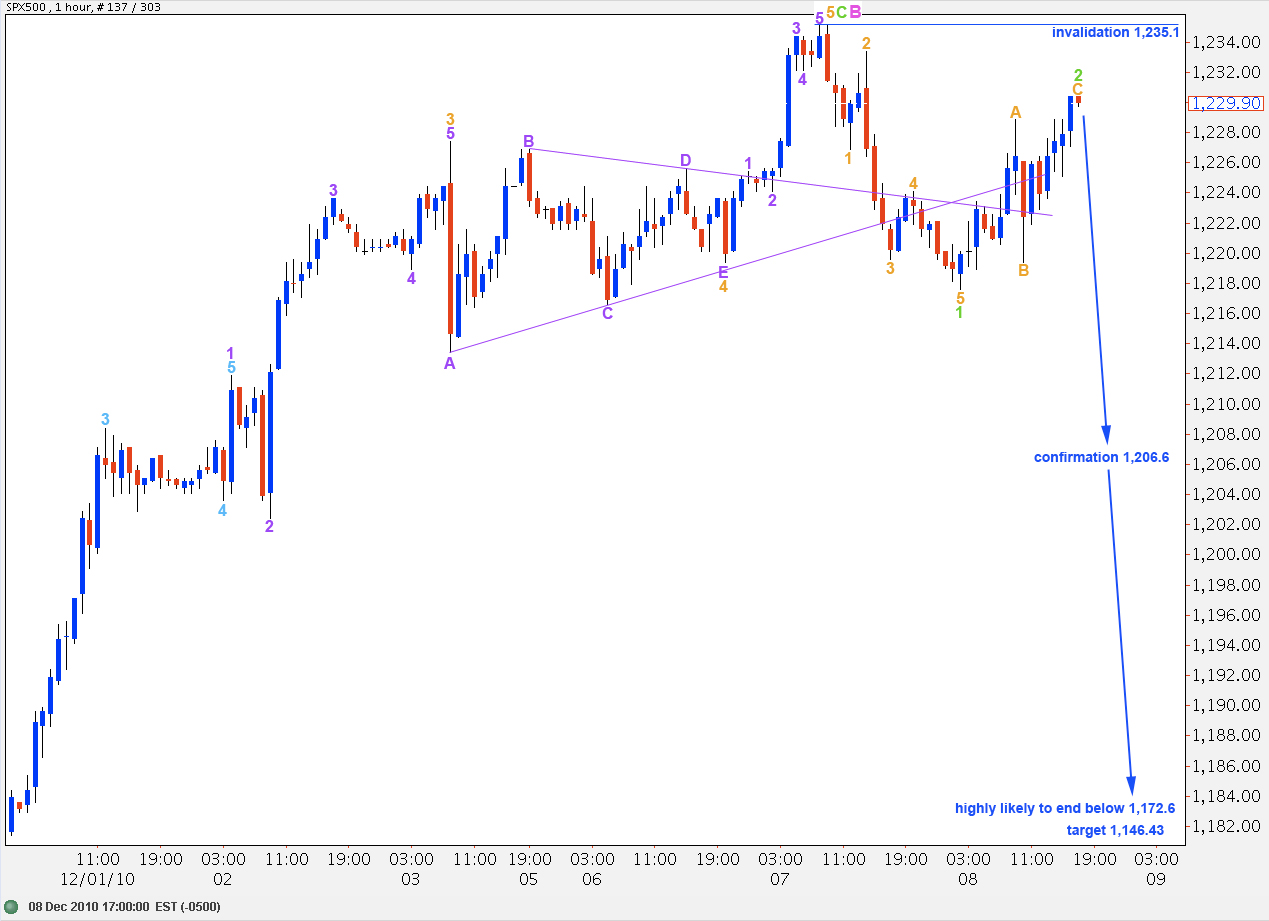
Exactly as expected we saw downward movement in a clear five wave structure, followed by a correction to the upside.
Wave 2 green may not move beyond the start of wave 1 green. Therefore, the invalidation point is at 1,235.1.
Ratios within wave 1 green are: wave 3 orange is just 0.5 points longer than 1.618 the length of wave 1 orange and wave 5 orange is 1.2 points short of 0.382 the length of wave 3 orange.
Within wave 2 green, wave A orange is a leading diagonal when viewed on a 15 minute chart. Wave B orange is an 84% correction of wave A orange. Wave C orange has just passed equality with wave A orange. Wave C orange will be just below 1.618 the length of wave A orange at 1,235.1; it may get very close to this point.
If wave 2 green extends any higher it may not move beyond the start of wave 1 green. Therefore, price should not rise above 1,235.1.
Alternate Wave Count.
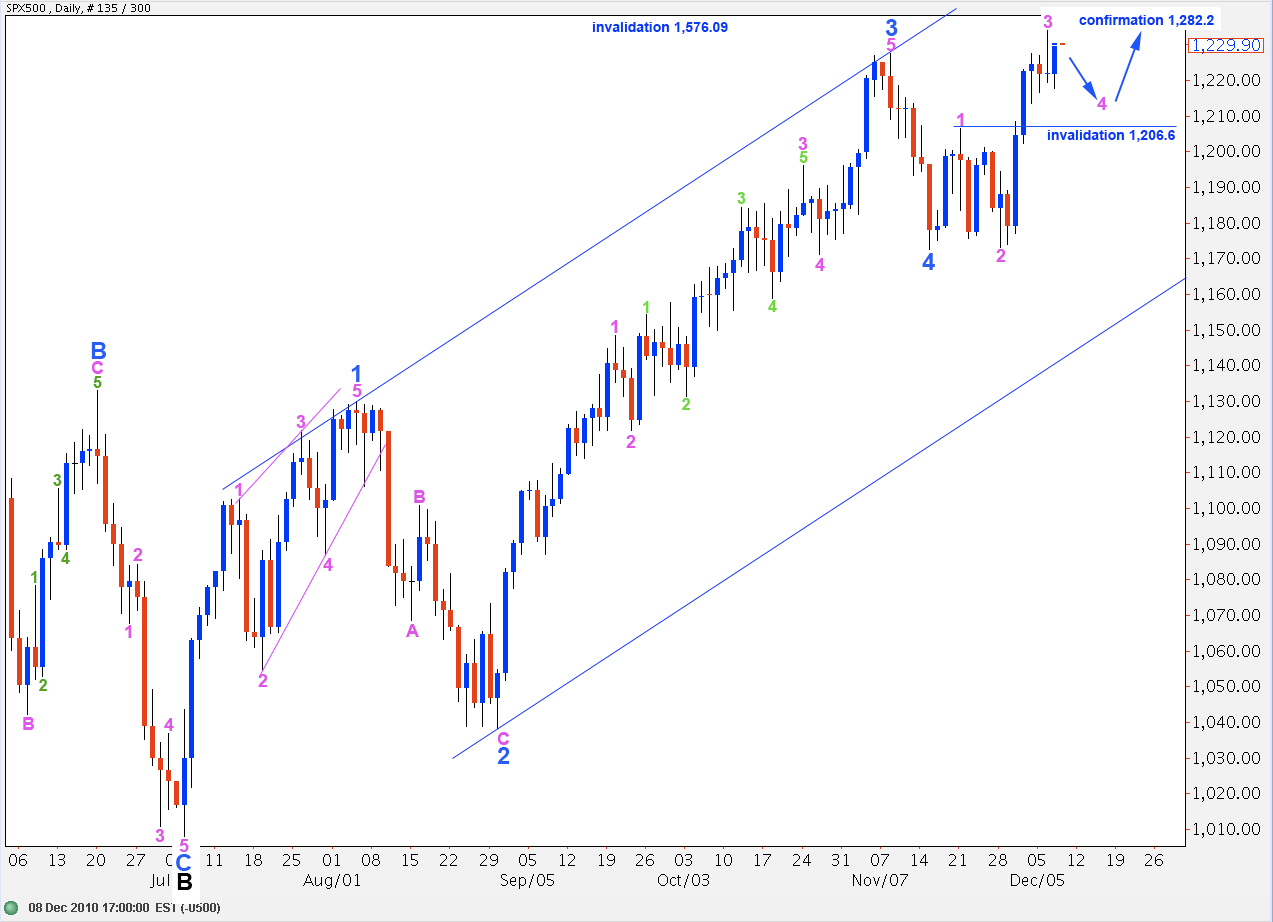
This remains technically viable but it looks less likely.
This wave count expects downward movement also, for a fourth wave.
Wave 4 pink may not move into wave 1 pink price territory. Therefore, this wave count is invalidated with movement below 1,206.6.
We may see this wave count invalidated during Friday’s session.
Hi Lara-Looks like “B” etended a bit further, no? Are we still on track to see “C” of an expanded flat?
Thanks. Robert
P.S. Looks like the dollar is minding nicely.