
Elliott Wave chart analysis for the SPX500 for 26th November, 2010. Please click on the charts below to enlarge.
As expected, the S&P moved a little higher then turned about the target for the triangle and moved strongly downwards.
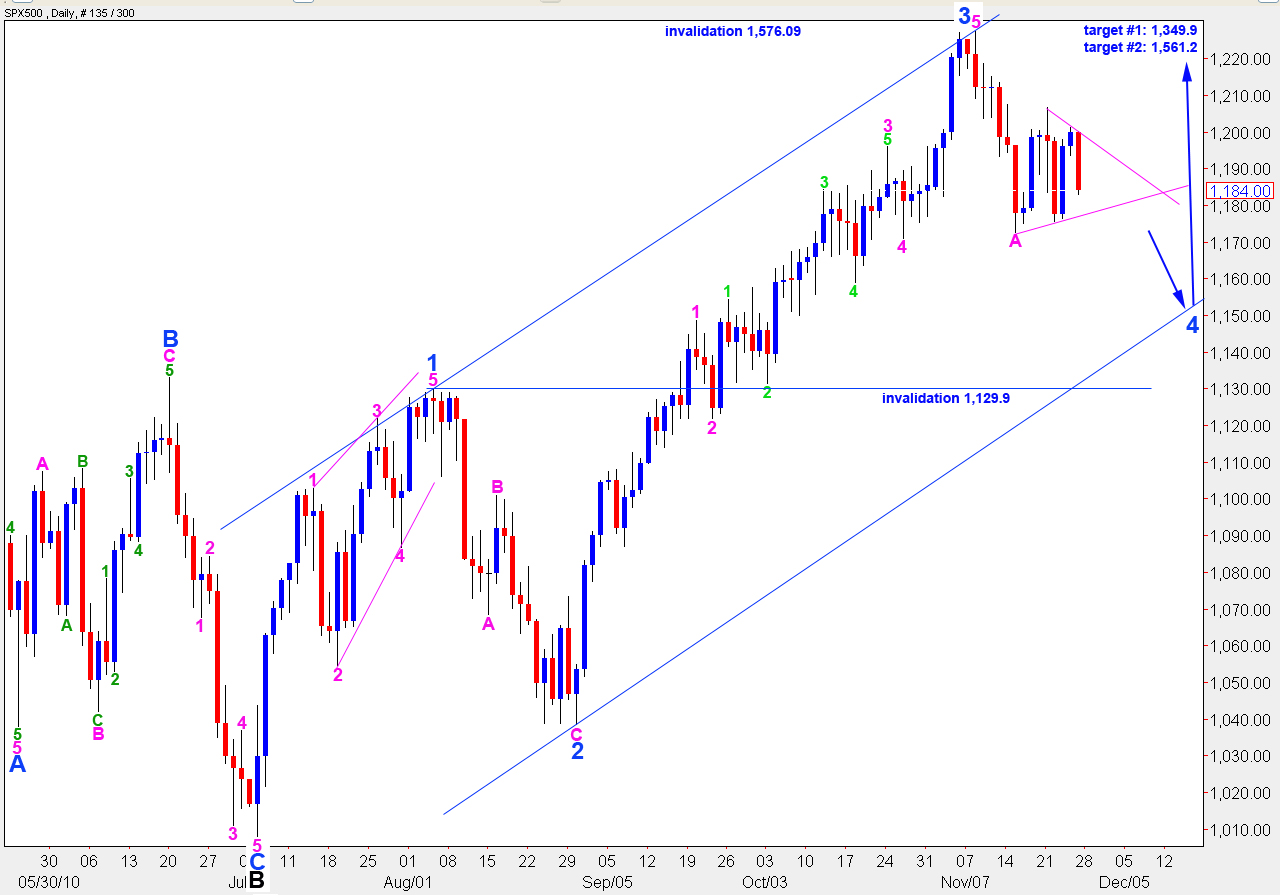
There is a strong looking triangle developing which is either in a B wave position of wave 4 blue (main hourly wave count) or is wave 4 blue in its entirety (alternate hourly wave count). The point of differentiation between the two hourly wave counts is at 1,201.1. Movement above this point in the short term will indicate a likely end to wave 4 blue. If price remains below this point we may expect wave 4 blue to move lower.
If wave 4 blue continues lower it may end about the 8th of December where it will last a fibonacci 21 days. If it ends sooner it may have no fibonacci time relationship.
Wave 4 blue may not move into wave 1 blue price territory. Therefore, price should not move below 1,129.9. If this wave count is invalidated with downward movement then we shall use the alternate daily wave count.
When wave 4 blue is over the next move for the S&P should be upward movement for a fifth wave. Upward movement may not move beyond the start of primary wave 1 at 1,576.09
Main Hourly Wave Count.
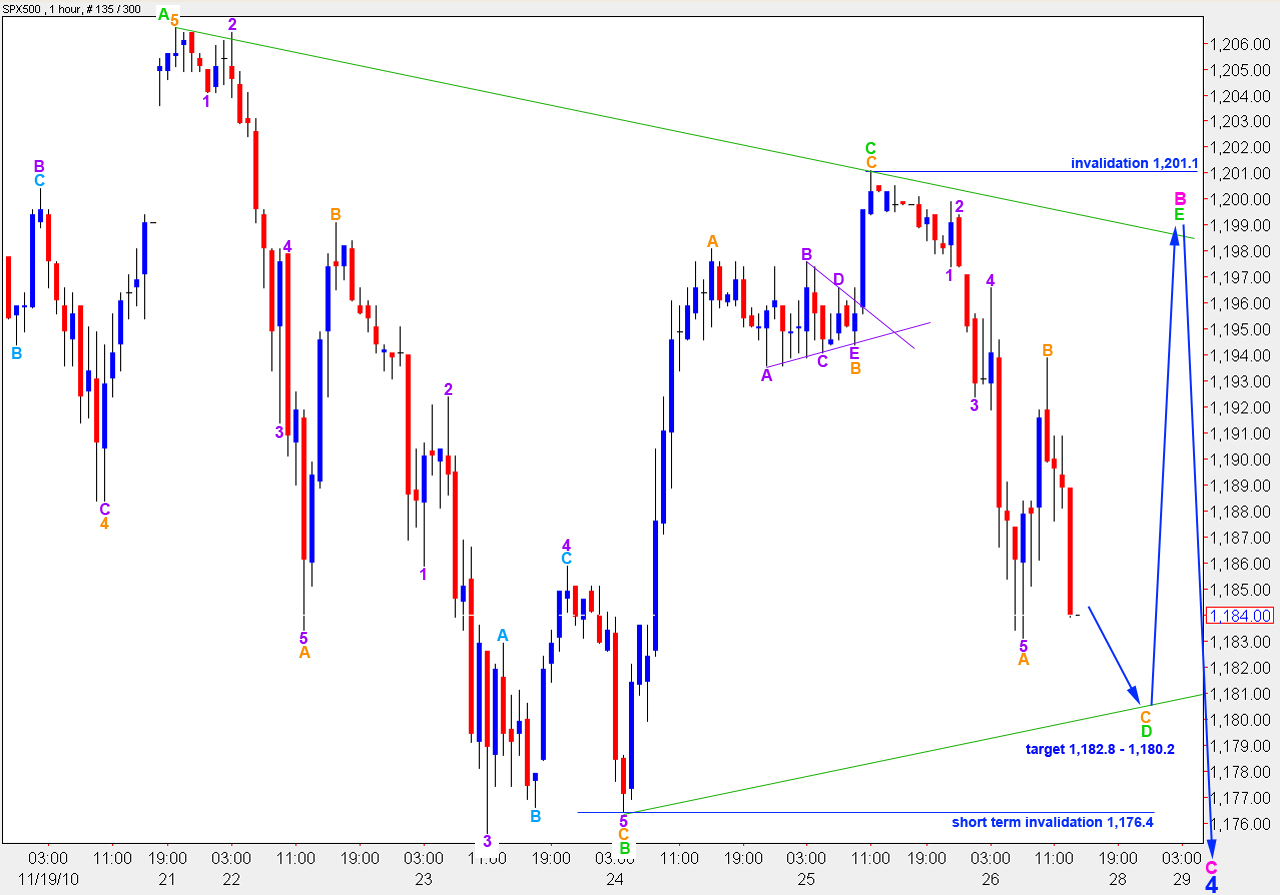
I have altered this wave count. We were expecting wave B pink within wave 4 blue was unfolding as a zigzag, however, it looks more now like a triangle.
We were expecting wave C green to end higher. It is unlikely, therefore, that wave B pink was over there with a very truncated C wave.
Subsequent downward movement is unfolding with a strong zigzag look which fits well with a triangle for wave B pink.
Wave D green may not move beyond the end of wave B green for a contracting triangle. Therefore, this wave count is invalidated in the short term with movement below 1,176.4.
At 1,182.8 wave C orange within wave D green will reach 0.618 the length of wave A orange.
At 1,180.2 wave D green will reach 82% the length of wave C green mirroring the relationship between waves B and C green.
Wave E green may not move beyond the end of wave C green. Therefore, this triangle for wave B pink is invalidated with movement above 1,201.1. Wave E green is likely to undershoot or overshoot the A-C trend line.
If this triangle structure for wave B pink remains valid then the subsequent wave C pink to end wave 4 blue is likely to be about 34 points to the downside.
Alternate Hourly Wave Count.
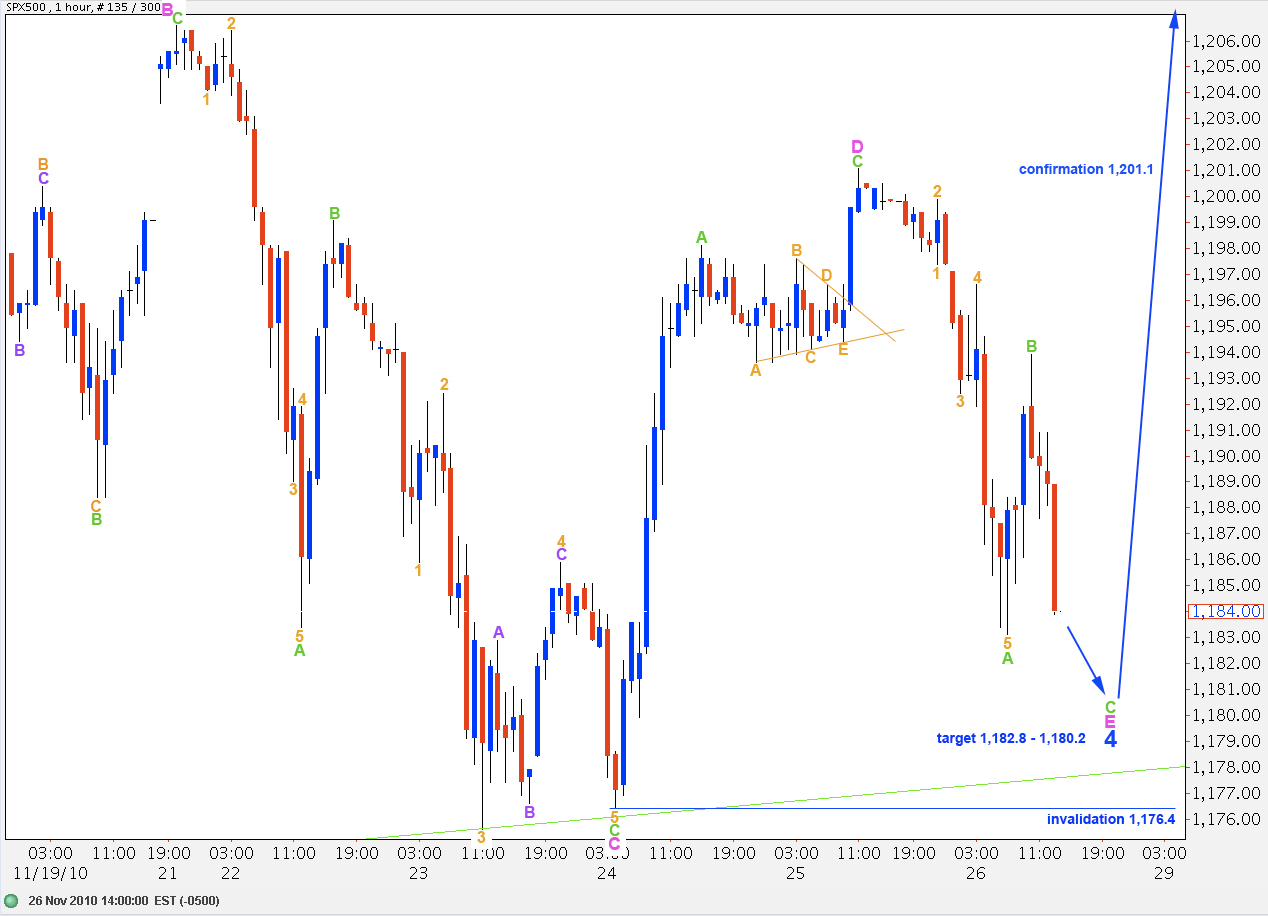
This wave count sees wave 4 blue in its entirety unfolding as a triangle. The overall look for this wave count is slightly less satisfactory than the main hourly wave count.
This wave count requires only an end to wave C green to end wave E pink, the final wave of this triangle. Wave E pink may not move beyond the end of wave C pink below 1,176.4. Wave E pink is likely to undershoot or overshoot the A-C trend line.
If price moves above 1,201.1 this wave count will be confirmed with invalidation of the main hourly wave count. At that stage we may expect upward movement for the S&P to continue for a couple of more weeks or longer towards targets on the daily chart.
Alternate Daily Wave Count.
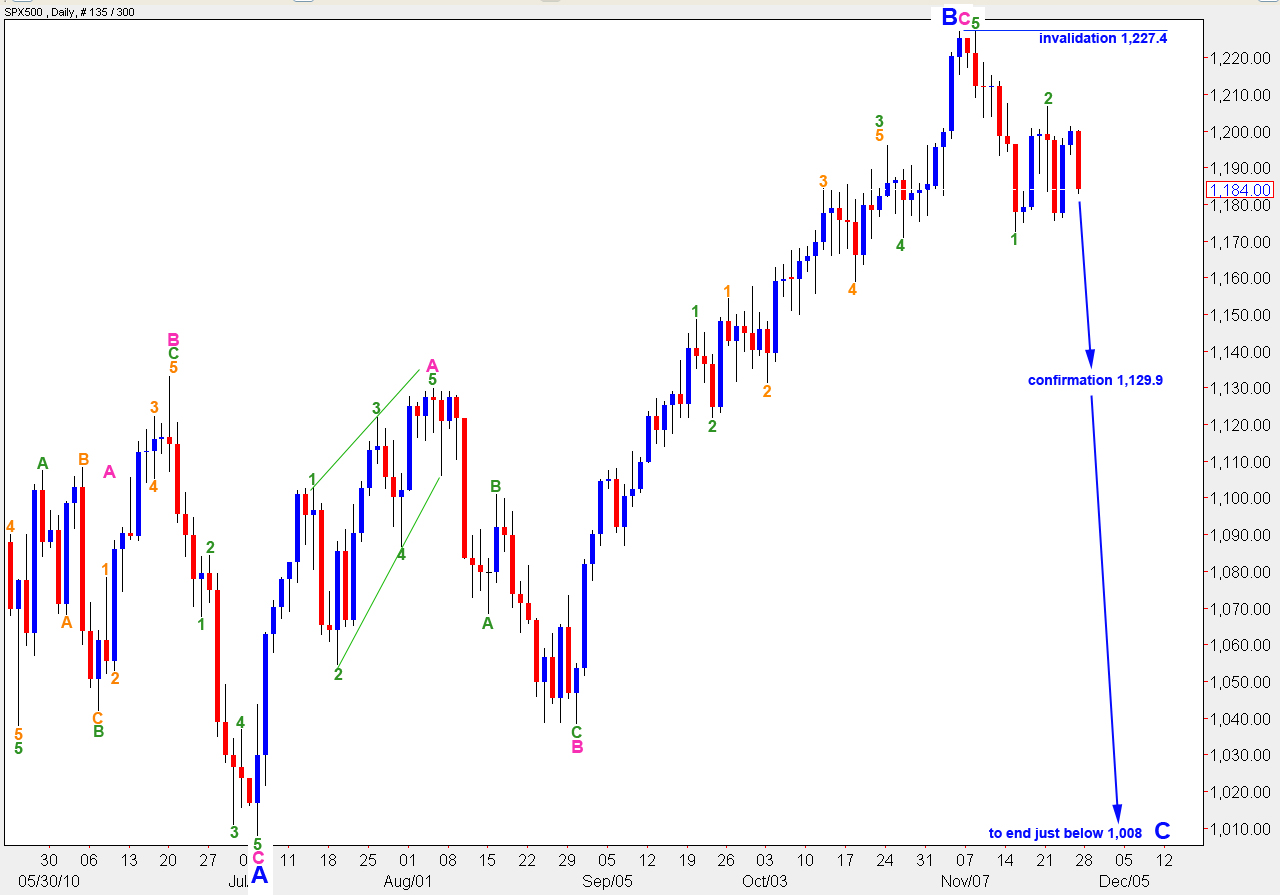
This alternate wave count expects wave B black is still unfolding as a regular flat correction.
Wave B blue was 103% the length of wave A blue. Therefore, this structure is a regular flat correction and wave C blue is most likely to end just beyond the end of wave A blue, below 1,008.
If the main wave count is invalidated with movement below 1,129.9 this alternate wave count will be correct. At that stage we may expect there is a very high probability of downward movement continuing and ending only below 1,008.
Wave 2 green may not move beyond the end of wave 1 green. Therefore, this wave count is invalidated with movement above 1,227.4
The current correction looks a little like a miniature version of the correction from April to July. Let’s say this analogy is correct, then the SPX should chart a distinctive 5 waves up from about 1176 or so. In other words, wave 5 up may have started already. Contradicts what I said earlier, I know, but food for discussion, nonetheless.
Well it is possible however we wont know that for sure until 1129 is breached. And the proportions dont look very nice with such a small 4th. I think the main wave count with the triangle looks very good. And I really hope the traingle is correct cause it would probably make a pretty sweet entry point as Lara said.
This is how I see The S&P cash at 1min timescale. We should be travelling to the upper again green this week.
http://i53.tinypic.com/2rggnxf.jpg
“the upper green line again” that is
Hi all, I’m back. I’ve had a quick look this morning at the S&P and Louis is right, it’s the triangle in wave B pink position which looks correct. I can see a combination alternate also possible so I’ll chart that for you too, but that triangle looks most likely. Wave 4 blue is most likely not yet over.
The SPX may have topped out already. Blue 3 on the first chart may really be blue 5. I see the 4th. wave as having been a brief affair of about 5 bars from the green 5 (about 1200). The fall from 1220 to 1175 looks impulsive and the present scratchy attempt at upwards movement looks very corrective. Could we be in Wave 2 down?