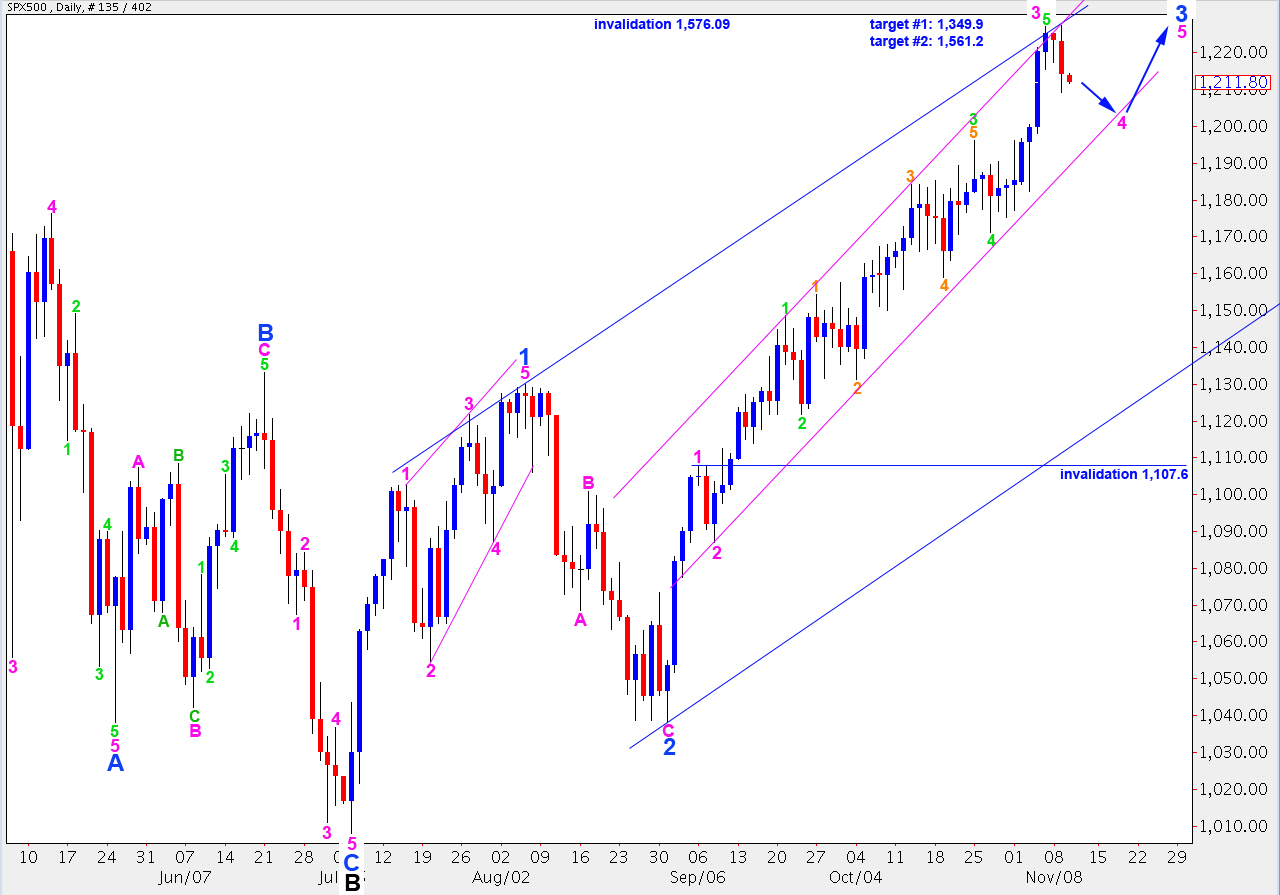
Elliott Wave chart analysis for the SPX500 for 9th November, 2010. Please click on the charts below to enlarge.
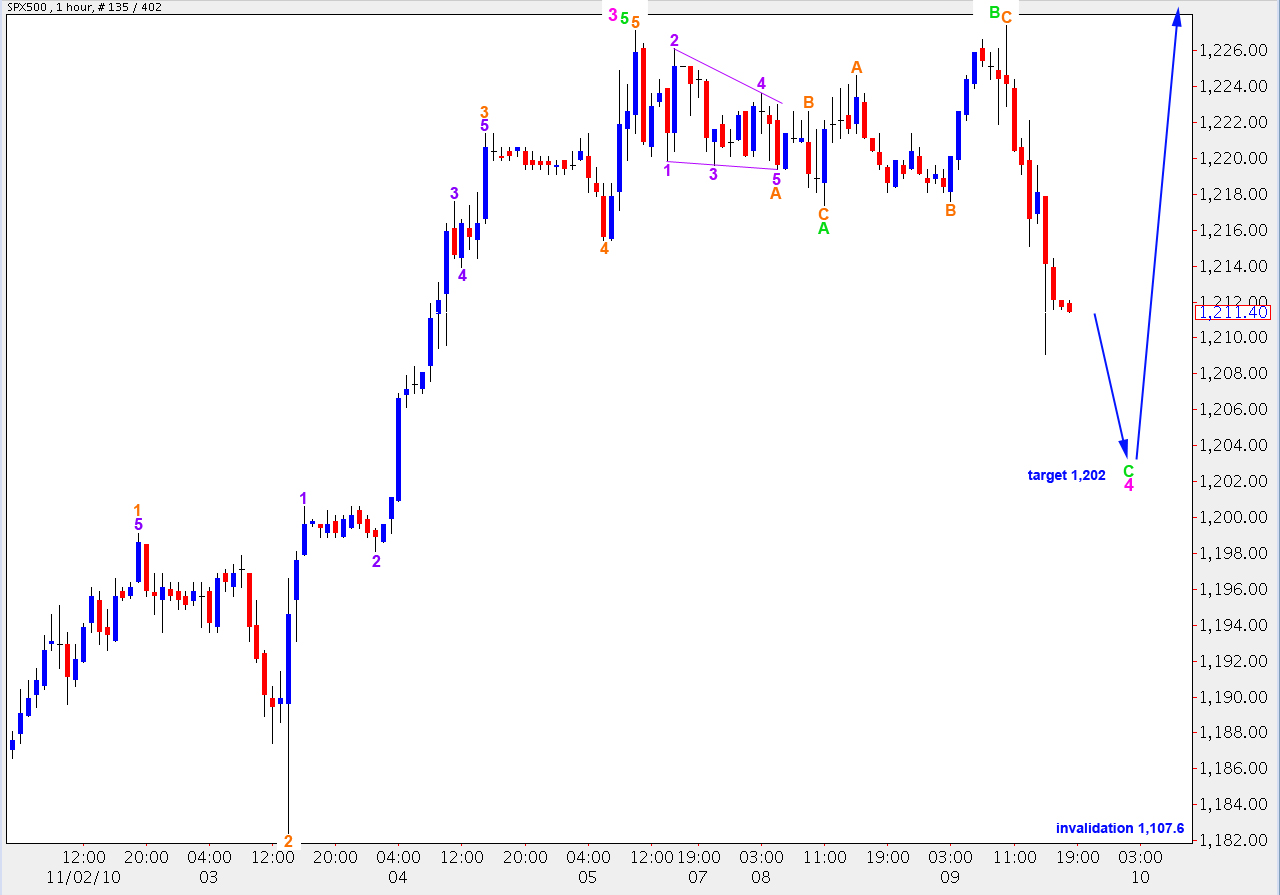
The S&P has begun a downwards correction as expected but the invalidation point to the upside on the hourly chart was breached by 0.3.
Targets for the daily chart are long term targets for the end to wave C black and an end to primary wave 2. At 1.3949 wave C black will reach 0.618 the length of wave A black. At 1.5162 wave C black will reach equality with wave A black, which is the most common relationship between the two and, therefore, a more likely upwards target.
In the mid term the S&P will have a fourth wave correction at blue (minor) degree equivalent to wave 2 blue. This correction should end about the lower edge of the wide blue parallel trend channel and may take price downwards for a couple of weeks or longer.
Upwards movement may not make a new high above 1,576.09 as wave 2 at primary degree may not move beyond the start of wave 1.
Wave B green was expected to stay below 1,227.1. It has ended 0.3 above this at 1,227.4. Therefore, wave A green was a three wave structure.
Wave B green was a 103% correction of wave A green which is not enough for an expanded flat correction. However, wave C green has already reached beyond 1.618 the length of wave A green (at 1,211.7). Therefore, the next downwards target for wave C green to end is at 1,202, at 2.618 the length of wave A green.
Downwards movement may not move below 1,107.6 as wave 4 pink may not move into wave 1 pink price territory.
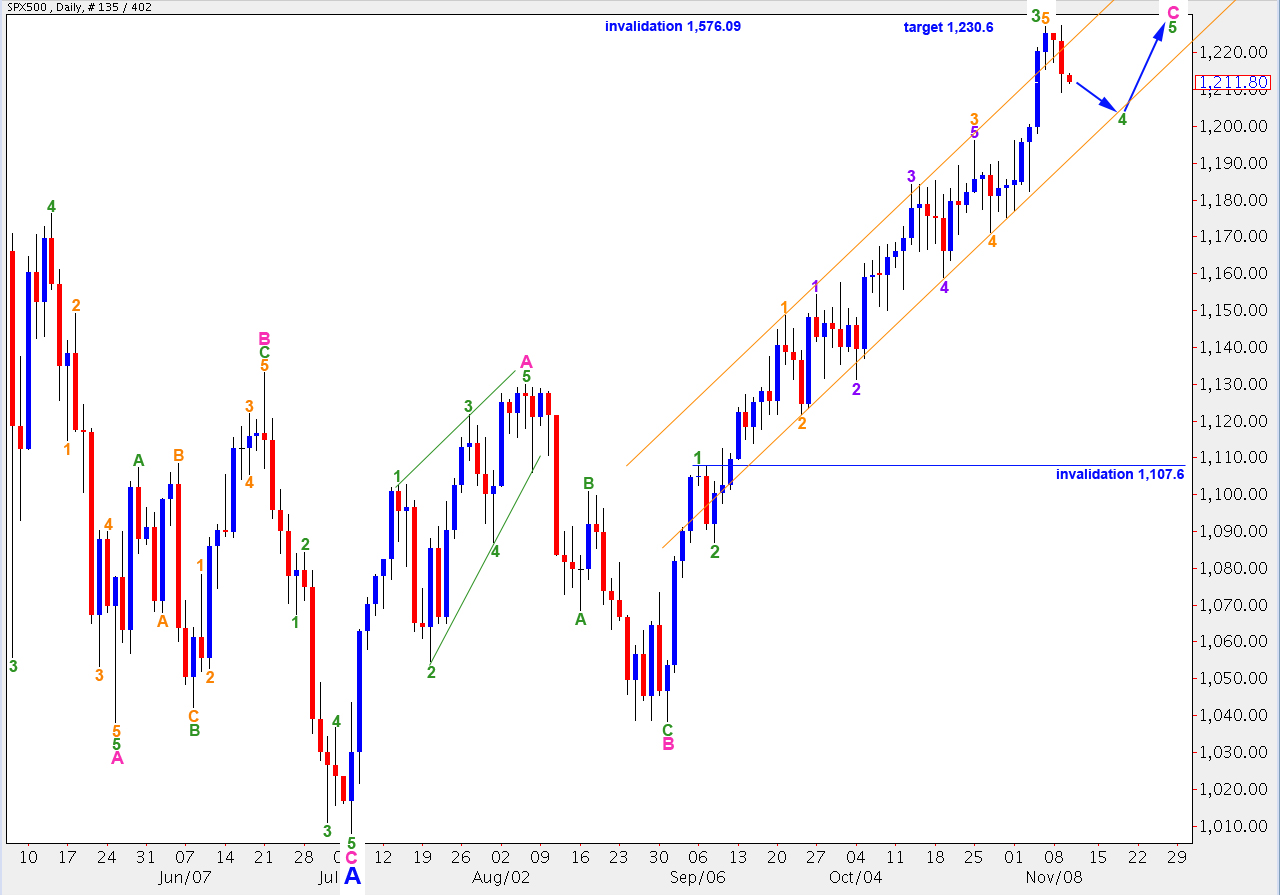
Alternate Wave Count.
The short term outlook for this wave count is the same as the main wave count. The downwards invalidation point is the same.
At 1,230.6 wave B blue will reach 105% the length of wave A blue which is the minimum requirement for an expanded flat correction. As this is the most common type of flat correction this upwards target is most likely for this wave count.
The upside invalidation point is the same as the main wave count, wave 2 black may not move beyond the start of wave 1 black at 1,576.09.


target missed by only 2 points and looks like were on our way for pink 5 , glad we’re on the right track again. 🙂
Hi Lara-Wondering if there is any chance that your blue ABC could be an X wave?
I know this is the SPX but I think the same count could apply.
Thank you.
Robert
http://www.screencast.com/t/3DVhGttk
Yes, it certainly could be an X wave.
I’ll keep it simple though and leave it as a 5-3-5 zigzag forming.
Lara,
You have wave B ending at 1227.4 yet all of the charts I looked at indicate a high of 1226.84 for the 9th of November (for example: http://stockcharts.com/charts/gallery.html?$SPX) . Since the 1226.84 did not reach your invalidation of 1227.1 does your count hold?
Thanks,
Mike
I am using a full data feed which includes after hours data, hence the difference. Because my wave count is based upon this data, therefore the invalidation point was breached. However, it’s pretty much academic as it’s still wave 4 correction, wave B of wave 4 just moved slightly beyond the start of A. Either way the structure would be pretty much the same, a flat correction.