
Elliott Wave chart analysis for the SPX500 for 5th November, 2010. Please click on the charts below to enlarge.
Main Wave Count.
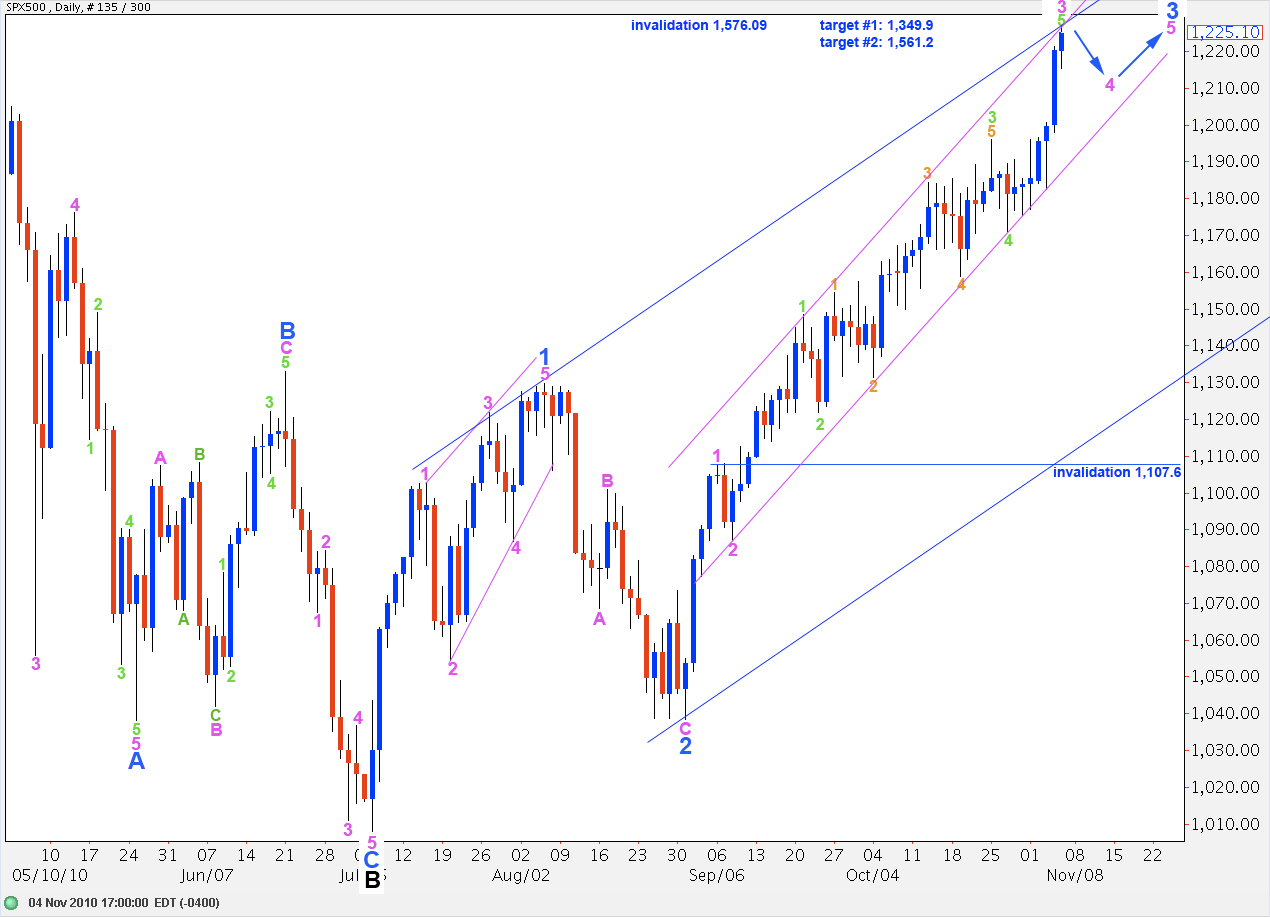
The S&P is due for a correction very soon. What is unclear is what degree of correction we will be seeing. Friday was the 89th day of wave C black; this is a likely point for a correction to develop from.
This wave count sees a fourth wave at pink degree developing. It is also possible that this fourth wave to develop may be at blue degree.
Wave 4 pink may not move into wave 1 pink price territory. Therefore, price may not move below 1,107.6.
The middle of wave 3 green is a text book perfect impulse. Wave 3 orange is just 0.3 points longer than 1.618 the length of wave 1 orange and waves 1 and 5 orange are just 4.7 points off equality.
We could label this upwards movement for wave 3 blue differently, but to place the labels for the central part of the third wave differently would be to not label this central impulse as you see here. Such labeling may be technically correct but it does not have the best look or fit. We may, however, label this upwards movement at different wave degrees, keeping the labeling of the central portion with the numbers in the same place.
The narrow pink trend channel drawn here around wave 3 blue is a best fit. We may see upwards movement contained within it, with small overshoots possible. If price moves strongly outside the lower edge of the channel then the correction is more likely to be at blue (minor) degree.
The wide blue parallel channel is drawn around wave C black in its entirety. If price moves higher we will need to redraw the channel. A fourth wave at blue degree may end about the lower edge of the channel.
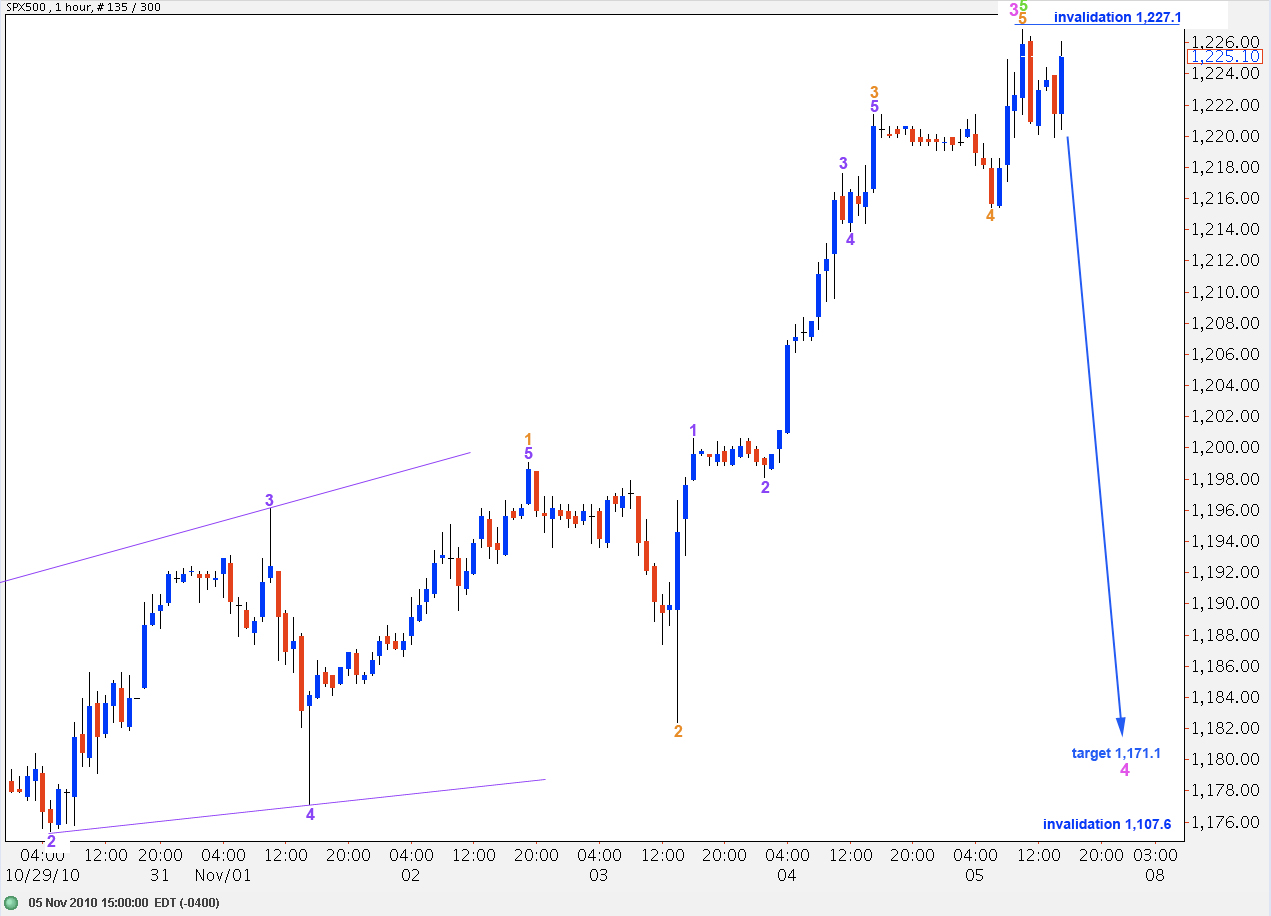
It is possible that upwards movement is over for now and a correction may develop to the downside.
If the correction is at pink degree then the target is about the fourth wave of one lesser degree, wave 4 green, at 1,171.1.
Wave 4 pink may not move into wave 1 pink price territory. Therefore, price may not move below 1,107.6.
If the correction is at blue wave degree then wave 4 blue may not move into wave 1 blue price territory, below 1,129.9, and the target is the same.
If price moves above 1,227.1 then this wave count will be invalidated and we should use the wave count below.
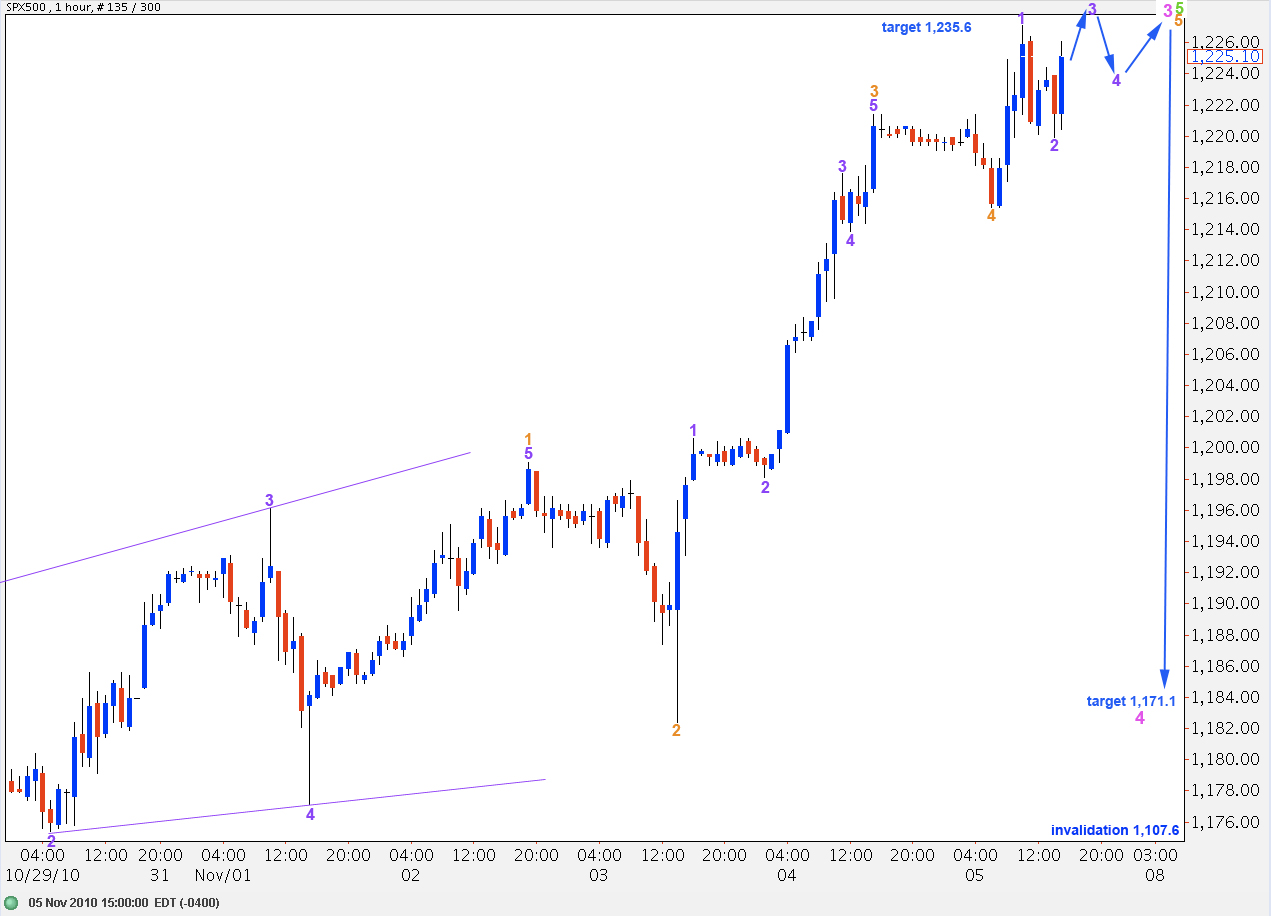
Because the last piece of movement to end the trading week has a clear three wave structure to the downside, wave 5 orange may not yet be over. With a new high we will, therefore, require further upwards movement to complete a satisfactory impulse structure.
At 1,235.6 wave 3 blue will reach 1.618 the length of wave 1 blue. This is the short term target for upwards movement.
Alternate Wave Count.
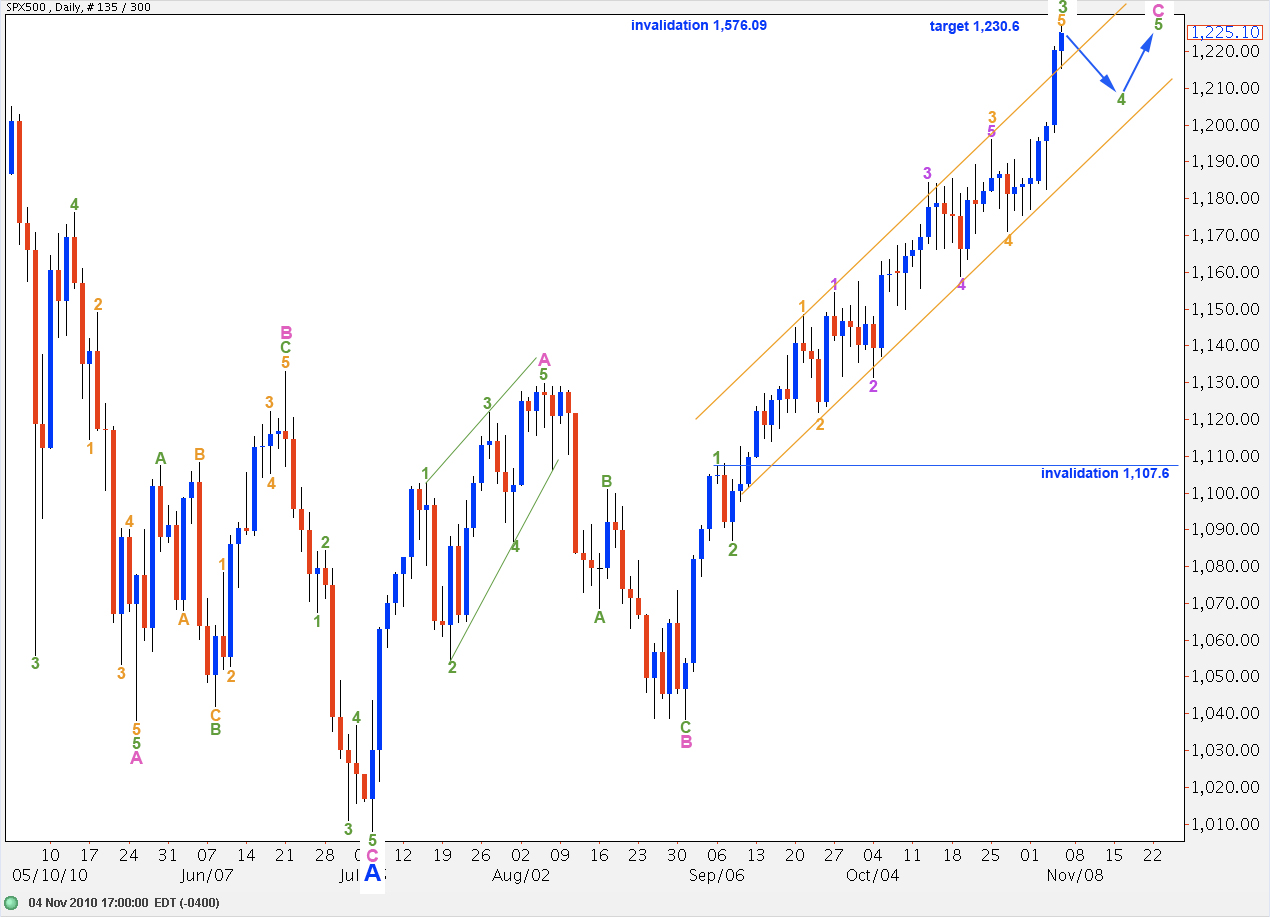
It is possible that the S&P is in minor wave B of intermediate wave B which is unfolding as an expanded flat.
At 1,230.6 wave B blue will reach 105% the length of wave A blue. This is the minimum requirement for an expanded flat correction.
Thereafter, a strong C wave to the downside should develop which is most likely to reach significantly beyond the end of wave A blue below 1,008.
While wave 4 green correction is unfolding price may not move below 1,107.6 as wave 4 green may not move into price territory of wave 1 green.
if i look at the weekly s&p chart i see some very serious (going back multiple years) horizontal resistance in the range of 1233-1240 this fits very nicely with the wave 3 blue target 1,235.
Lara,
Thanks for this analysis. Do you have any thoughts on how to trade this? I was thinking of trying to trade at Blue degree (anything less seems too difficult). The problem is that with few invalidation points nearby, it may be difficult to manage risk.
Peter
I think the best way to trade with EW is at the daily chart level on minor (blue) degree waves. However, one would then have to use daily chart invalidation points and the risk would be significant. Waiting for an opportune entry point at the end of a correction would be the best approach.