
Elliott Wave chart analysis for the SPX500 for 4th November, 2010. Please click on the charts below to enlarge.
Upwards movement has invalidated the wave count at primary degree. I have updated the historical wave count today.
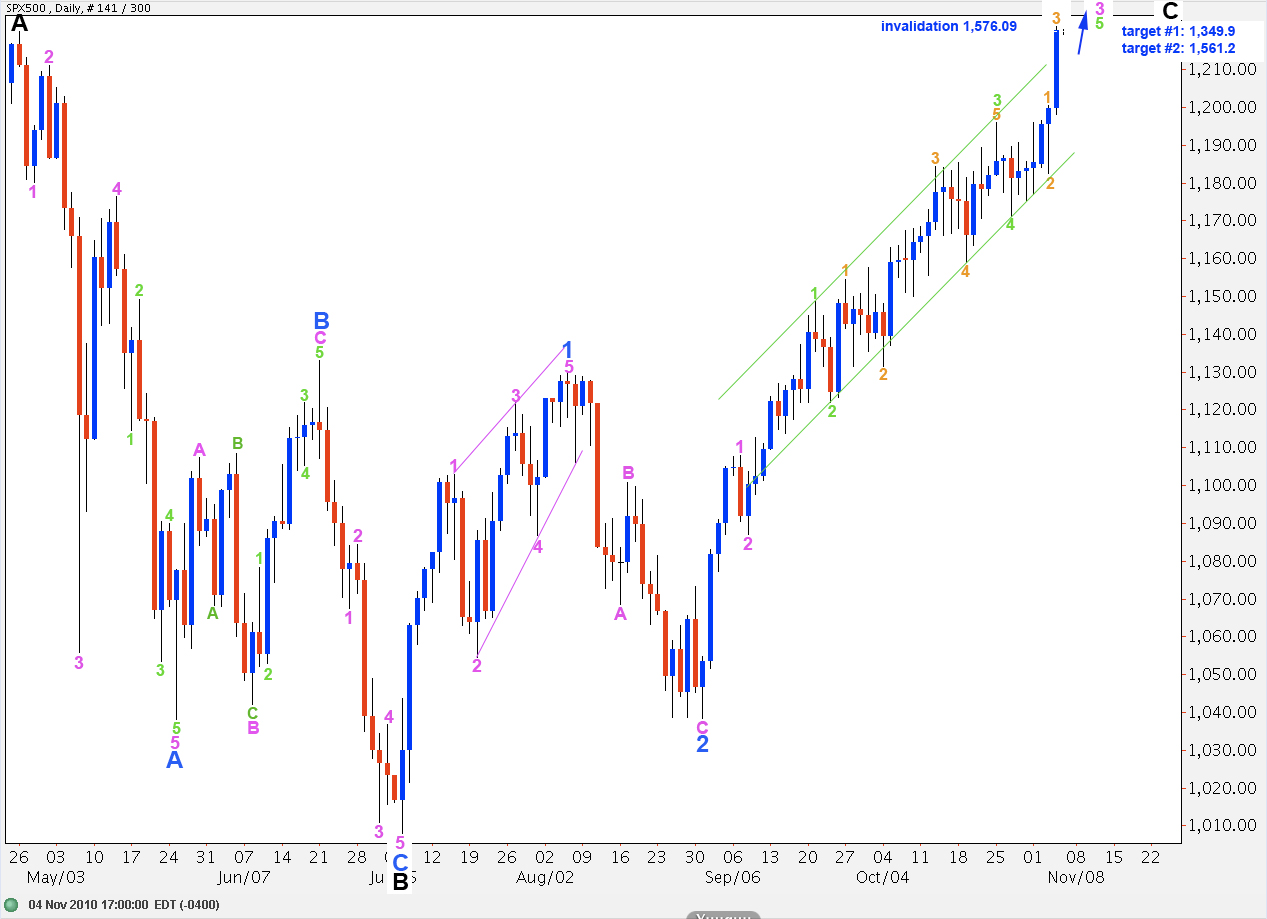
The S&P is still in the middle of primary wave 2 of cycle wave C.
We no longer have divergence between price and MACD. With today’s strong upwards movement the S&P looks like it is in the middle of a third wave.
Long term targets for the end to wave C black are initially at 1,349.9 where wave C black will reach 0.618 the length of wave A black. Thereafter, if the structure requires further upwards movement to complete it, the next target is at 1,561.2 where wave C black will reach equality with wave A black. This higher target may be more probable as this is the most common relationship between waves A and C of a zigzag.
When wave 3 blue (minor) is over we should see a downwards wave of equal size in duration to blue wave 1 here.
Ratios within wave 3 green are a perfect impulse: wave 1 and 5 are just 4.7 points off equality and wave 3 is just 0.3 points longer than 1.618 the length of wave 1 orange. This is a textbook perfect impulse, giving confidence that this portion of the labeling is correct.
This wave count is now only invalidated by movement above 1,576.09 as wave 2 at primary degree may not move beyond the start of wave 1.
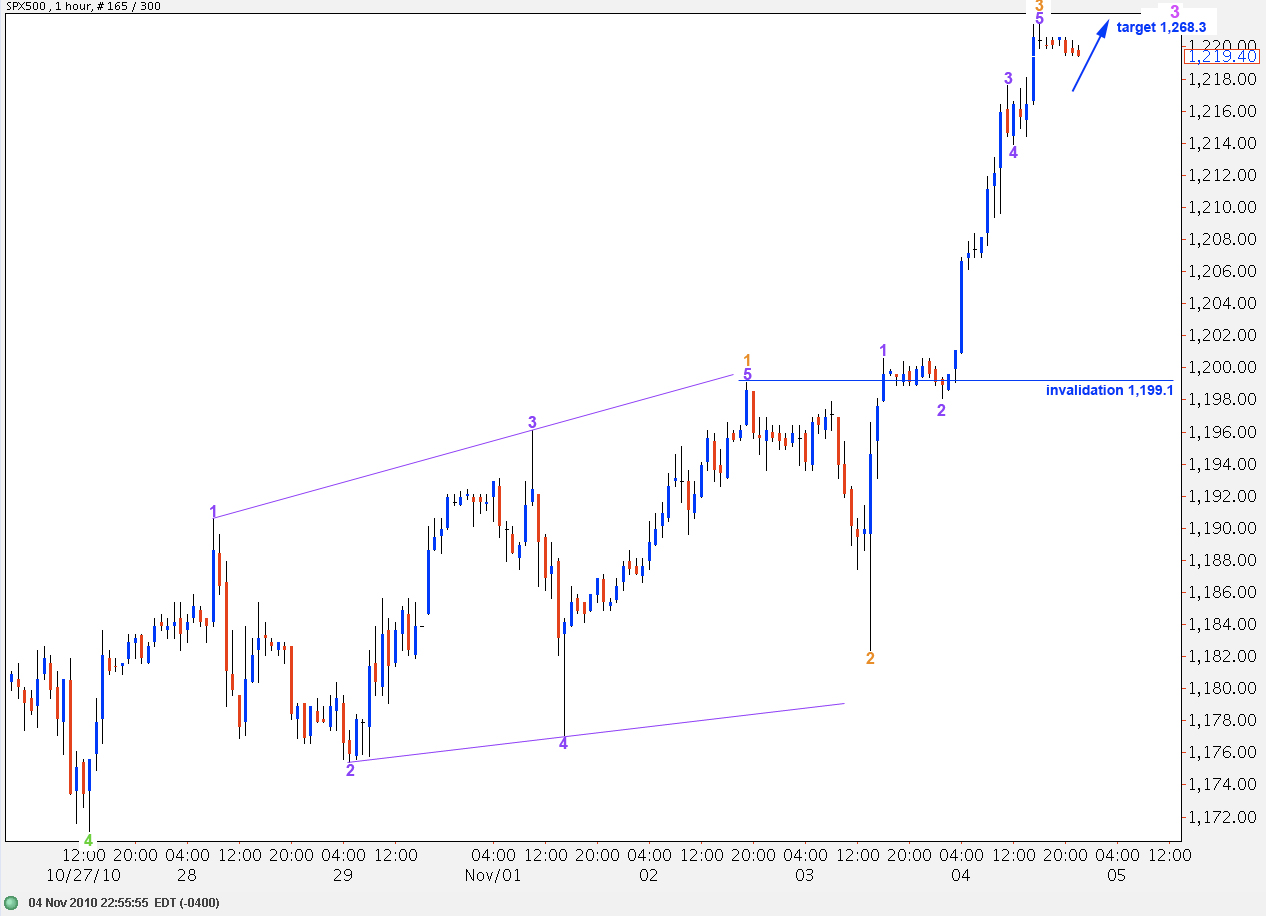
Within minor wave C we are towards the end of the third wave.
Wave 1 orange is a leading expanding diagonal which meets all rules and guidelines.
Wave 3 pink will reach 2.618 the length of wave 1 pink at 1,268.3.
Just to clarify my comment ,that is exactly what I meant. It cannot be a fact . If you look at a chart from 100 years ago you will see evidence of the same underlying emotion .Greed and Fear. My other comment would be that the E/W analysis and targets in the next few weeks will be even more critical than those of the past few weeks.
Correct me if I am wrong as am not an E/W expert however it seems to me that the insinuation is that E/W is not applicable to the markets anymore due to Fed intervention. Are we then to assume that Bernanke and co have managed to change their biological and psychological make up and are now operating in another sphere thus rendering the original premise of E/W null and void.
Its a common insinuation. Its not a fact.
Not trying to create a self fulfilling prophecy, but I find it interesting that if you were to still label the move off the July lows as an ABC, then in the low to mid 1230’s, C would reach 1.618 the length of A. Also, at that point, the minimum target for Wave B in an expanded flat ( 105%) would have been met.
But, as always, gotta trade what we see and not what we wanna see.
Lara. We hit the 61.8 retracement off the 2007 highs today, and it was also the 89th day of this upwave. Also am remembering your frequent assessments over the last several weeks that this is an expiring trend and clearly corrective with its overlapping behavior.
I just cannot get comfortable with the idea of making any trades on the long side at this point for many reasons until some kind of correction has taken place.
Lara, Can you also look at time cycles as well. This might also give us some insight as to what will take place. Thanks – this sure is an interesting time-scarry.
Lara,
I was wondering if you might be able to give us a sense of how long it might take for the remainder of Primary 2 to play out. Also, I now need to change my mindset to a more bullish one for the short to intermediate term (hard to do), and I was wondering if you had any thoughts on trading opportunities for the remainder of P2. Would you only trade the corrective waves, or would you be willing to go long, as well. Thanks.
Peter
At this stage, no. I’m going to have a more in depth leisurely look over the weekend and in the weekend analysis I hope to be able to answer that question with some accuracy.
As we have to assume that the trend remains the same until proven otherwise we have to assume the trend is up. We need to use channeling and invalidation points to indicate a trend change.
The change in the wave count means that the S&P now has more room to move upwards. More importantly we are now looking at a C wave which must be a five wave structure, and we are still in wave 3 of that. We should expect a wave 4 which is equivalent to wave 2, followed by a final fifth wave to complete this structure. Because wave 1 subdivided into a 5 wave C must be an impulse. Therefore wave 4 coming up cannot move into 1 price territory, so we could be nearing the end of 3 shortly as there is now enough room for a fourth wave to develop now.
Lara,
Is it possible that we are still in Wave B of P2, and that Wave B is developing as an expanded flat. Would that mean that what you have labeled as black B would actually be A of B(my understanding is that expanded flats are 3-3-5 structures)? Then the recent move above 1220 would satisfy the rule that B must move beyond the start of A, and we could be finishing up a three wave zigzag, to be followed by 5 waves down to complete Wave B, to then be followed by another 5 waves up to compete P2.
This seems rather complex, but I was just wondering if it met EW rules. Thanks.
Peter
Am also pondering this alternative, Peter. Hope Lara examines and addresses this in her analysis this weekend.
This is certainly another valid alternate and yes it is one that I will have to chart and consider when I do this weekends analysis. I’m finishing up the euro now and I’ll then have plenty of time over the weekend to do a thorough job on the S&P.
Fair enough, to change that strong expectation of a downturn is difficult. I will have clearer answers for you in a few more hours. It’s going to take me a while this weekend to do what I want to do for you.
In the short term though take a look at MACD. I’ve seen the pound do this before; you see plenty of divergence and it increases to tell you the trend is expiring, then just as you expect a trend change it shoots up in the same direction with new highs and stronger readings on MACD destroying the divergence.
hi Lara-
it seems to me that we have a bit of a conundrum with the markets at this point. i know we like to stick with the wave count but there is such a strong correlation with the dollar that it seems to make some sense to consider it.
do you see the dollar dropping below it’s 11/23/09 low and invalidating the present count? if not, i cannot see how the equity markets can extend much higher since this entire rally has been an inflation trade.
in addition, have you looked at the NDX100? It is very close to breaching it’s Oct. 2007 high. the Transportation Index is not far away either. certainly, if we expect the SPX to extend much further these other markets will breach the Oct. 2007 highs and then where will we be?
the Nasdaq and Transportation Index are considered by Dow theorists to be the leaders in the equity markets. what are the implications?
my thought is that based on all of the above we will see a trend change imminently unless the Fed is successful in crushing the dollar and creating another asset bubble. but what are the implications for EW analysis if this were to happen?
best regards,
robert
I agree that there may very well be a strong correlation with the dollar at this time. As funds move out of the stock market as it goes down, those funds should move into cash causing the dollar to rise.
At least that’s the idea.
However, as I recover from that sick sinking feeling that I’ve had since the Dow breached it’s invalidation point, I’m looking over what I had labeled as P2 and wondering why on Earth I labeled that as a triple zigzag. I had a question sent to me from a reader recently, new to EW, and that was his very question. My only conclusion is that I was heavily influenced by EWI’s wave count and I figured as they should be the experts their count would be a good place to start, if not just to be aware of.
So my conclusion is the wave count and structure are still going to give us an accurate idea of what is most likely to happen next, as long as we have the correct count. I’m going to spend some time over the weekend trying to see alternates. I’ll see if I can see a valid alternate which sees the S&P breaching it’s highest high. And I’ll see if I can see a valid alternate which sees the S&P moving down sooner than we expect. And I’ll play with trend channels trying to see which one will provide us with the most accurate indicator of a trend change.
And I will never again look at an EWI wave count.
But I’m not ready to give up on EW, it still fits and works. I see too many text book perfect structures with fascinatingly accurate fibonacci ratios within them to think this is all just a big coincidence.
Thank you for your response. I do think EWI is correct in it’s diagnosis that the dollar is key to all markets. This is about liquidity and where the money goes. In addition, I agree with them that these have become VERY crowded trades. The risk is all to the upside.
Look forward to seeing you conclusions next week.
Thank you.
Robert