
Elliott Wave chart analysis for the SPX500 for 1st November, 2010. Please click on the charts below to enlarge.
Upwards movement significantly has failed to make a new high on any of the markets that I analyse. Therefore, it is increasingly likely that we have highs in place.
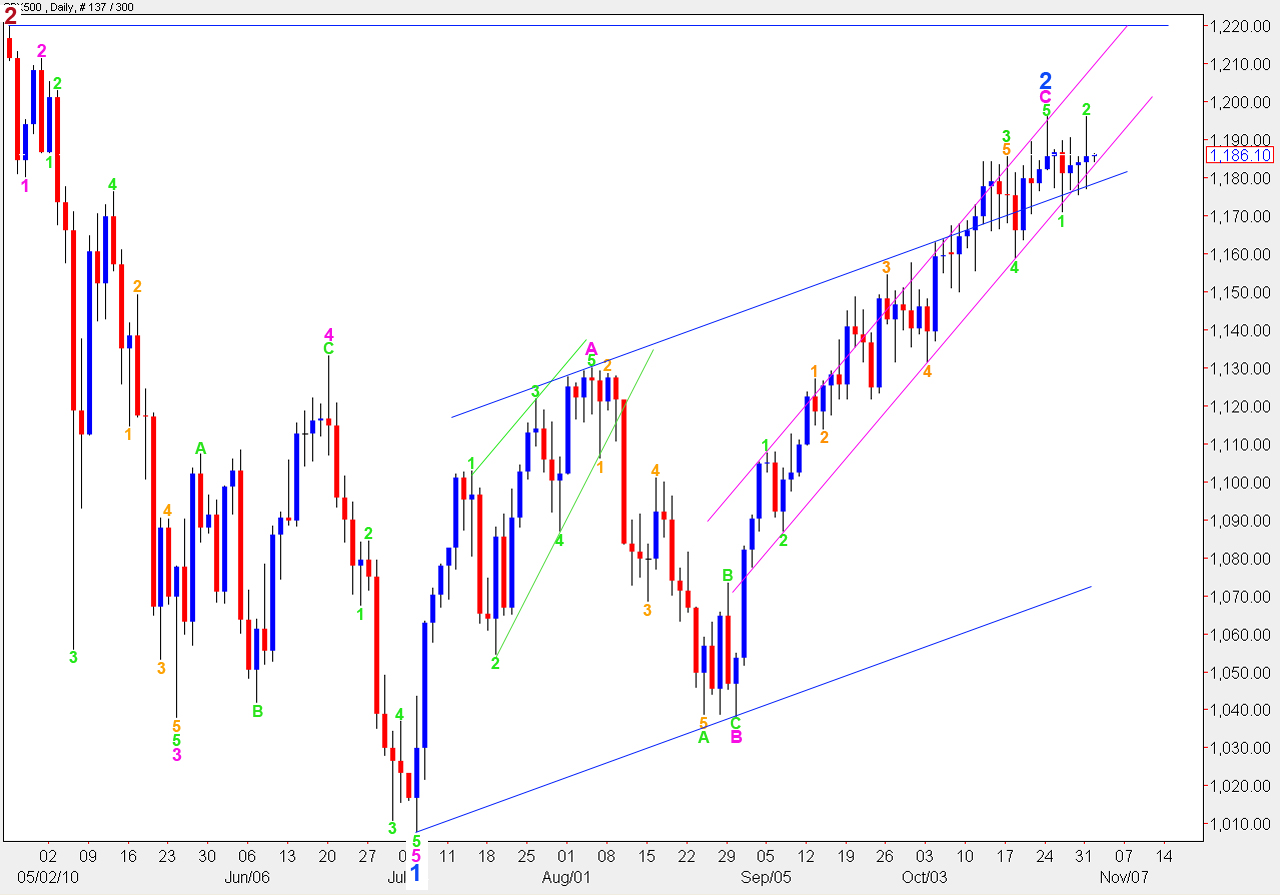
For the S&P500 we now have a perfect double top formed by a second wave correcting right up to the start of the first, on the main wave count.
If this wave count is correct then we should see downwards movement to break below the pink parallel channel this week.
When we can see a full candlestick closed and below the lower edge of the pink parallel channel then we shall have confirmation that the trend has changed from up to down.
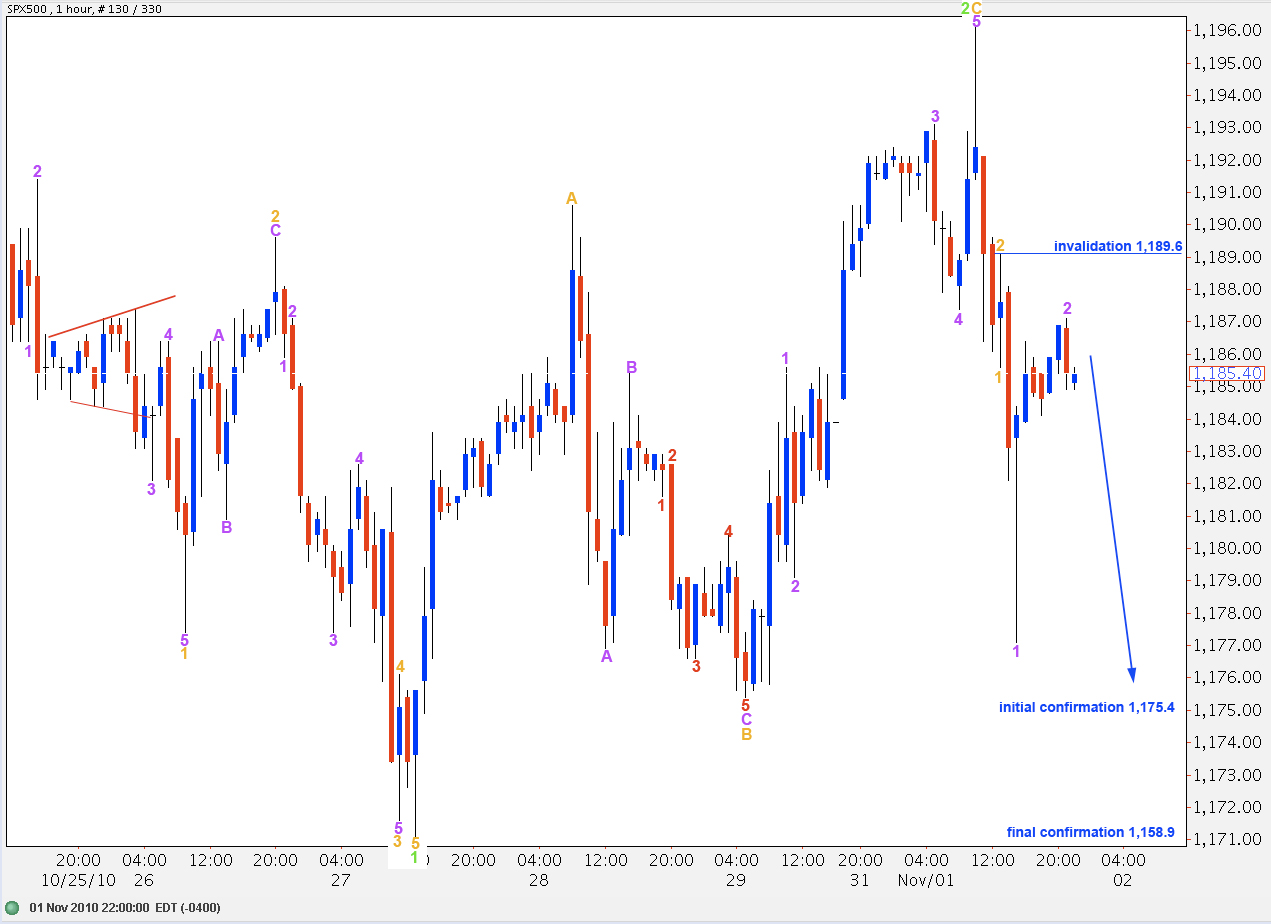
I have moved the labeling here all up one degree. Upwards movement above the invalidation point has necessitated a reanalysis of recent movement.
Upwards movement from the low at 1,171.1 labeled 1 green to Monday’s double top at 1,196.1 has an exaggerated zigzag look. Therefore, it is most likely to be a correction. Therefore, the trend is most likely to be down.
Ratios within wave 2 green are: wave C orange is just 1.2 points longer than equality with wave A orange.
Ratios within wave C orange are: wave 1 purple has no fibonacci ratio to either 3 or 5 purple but wave 5 purple is exactly 0.618 the length of wave 3 purple.
If my labeling of the most recent downwards movement is correct then we should not see price move above 1,189.6 as any further extension of wave 2 purple cannot move beyond the start of wave 1 purple.
Alternate Wave Count
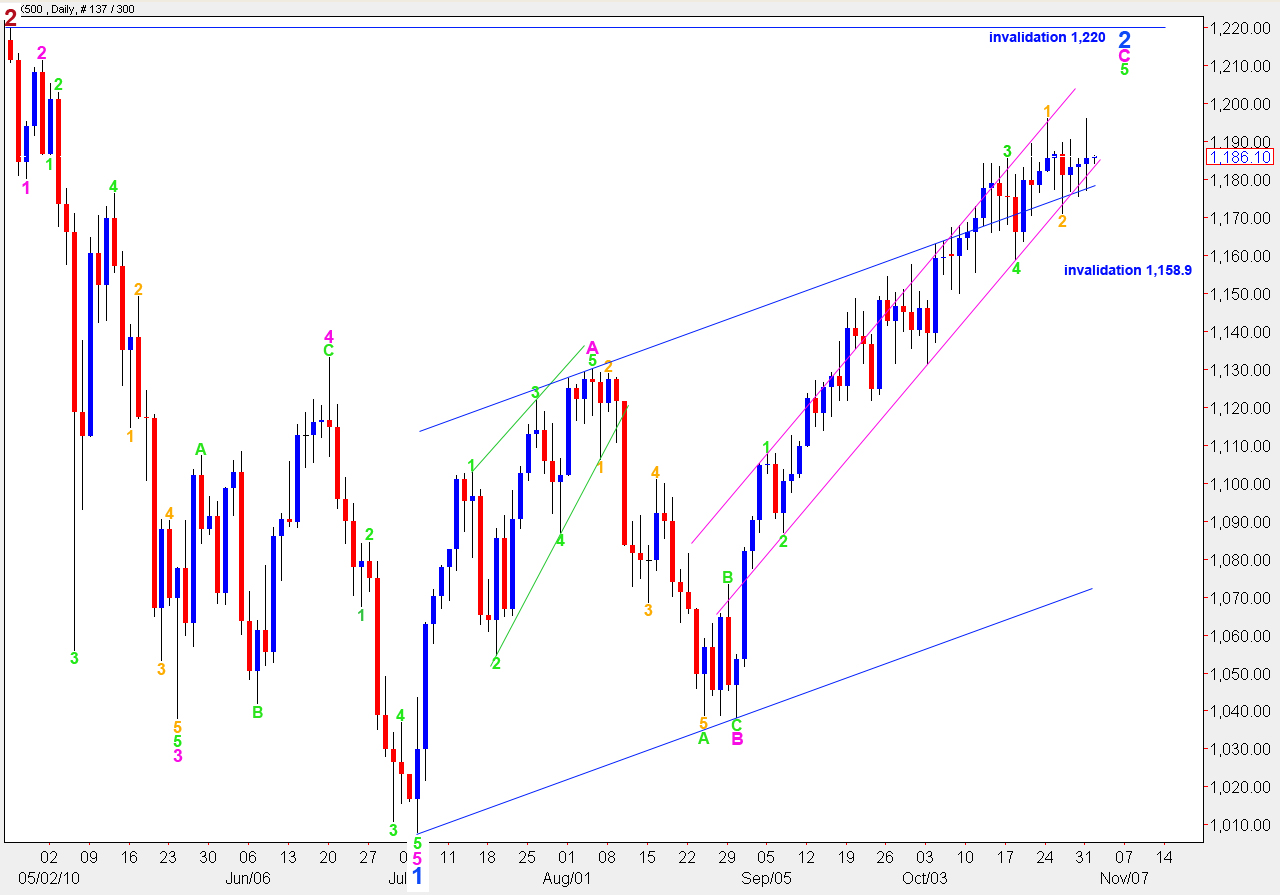
This wave count has the green labels in the same place as the main wave count. However, instead of seeing the last upwards wave as the end of a fifth wave we may only have seen the end of a first wave within the fifth.
This alternate wave count will be invalidated with movement below 1.158.9 as any further extension downwards of wave 2 orange cannot move beyond the start of wave 1 orange.
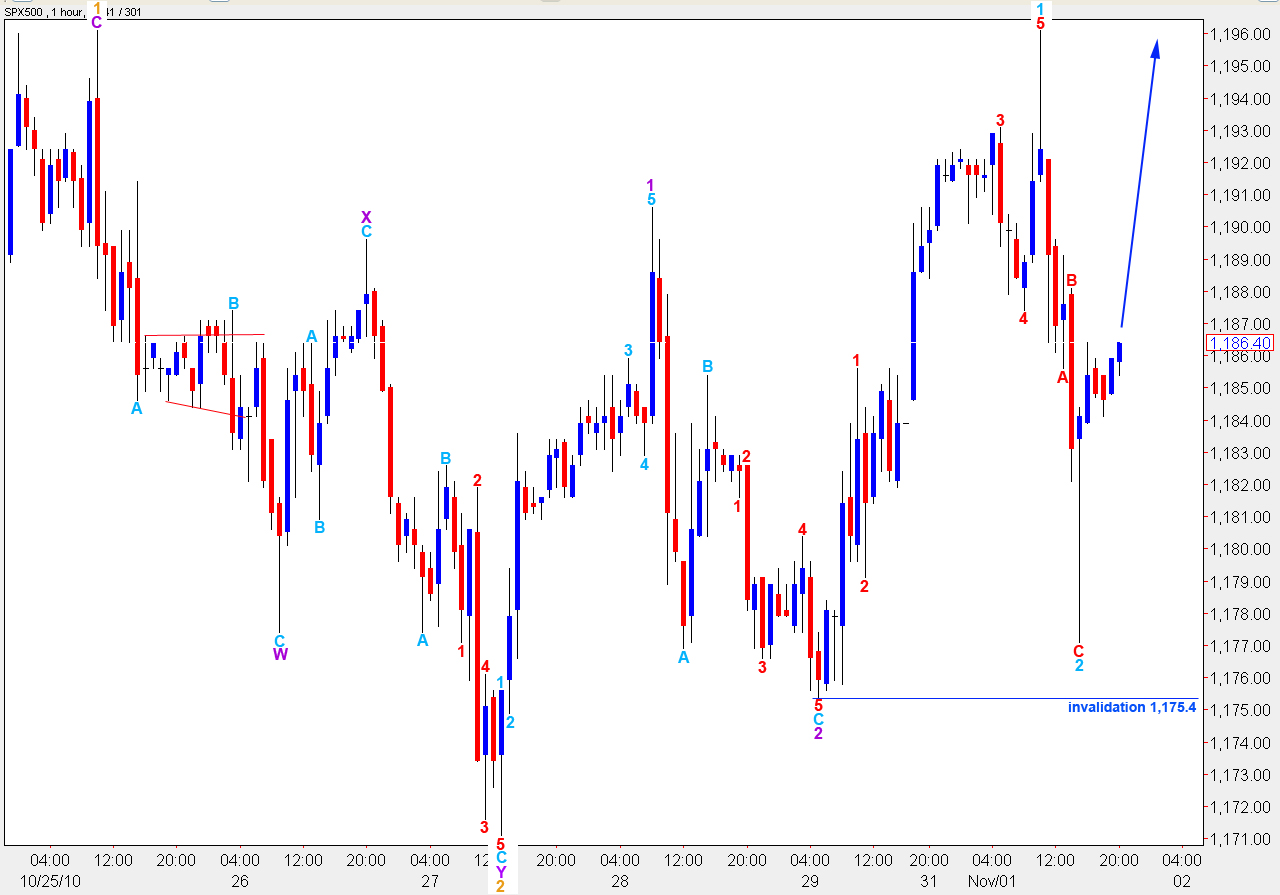
If this wave count is correct then we should not see price move below 1.175.4 as any further downwards extension of wave 2 aqua cannot move beyond the start of wave 1 aqua.
This wave count expects new highs from the S&P and could take price right up to 1,220.
However, with the overlapping of three first and second waves this wave count requires significant upwards movement to complete a satisfactory structure, even if it is adjusted for an ending diagonal. Wave 3 must move beyond the end of wave 1. Therefore, this wave count requires price to move above 1,196.1 to a new high. There does not seem to be enough upwards room left for this structure.
I wouldn’t be shorting this market other than intraday.