
Elliott Wave chart analysis for the SPX500 for 27th October, 2010. Please click on the charts below to enlarge.
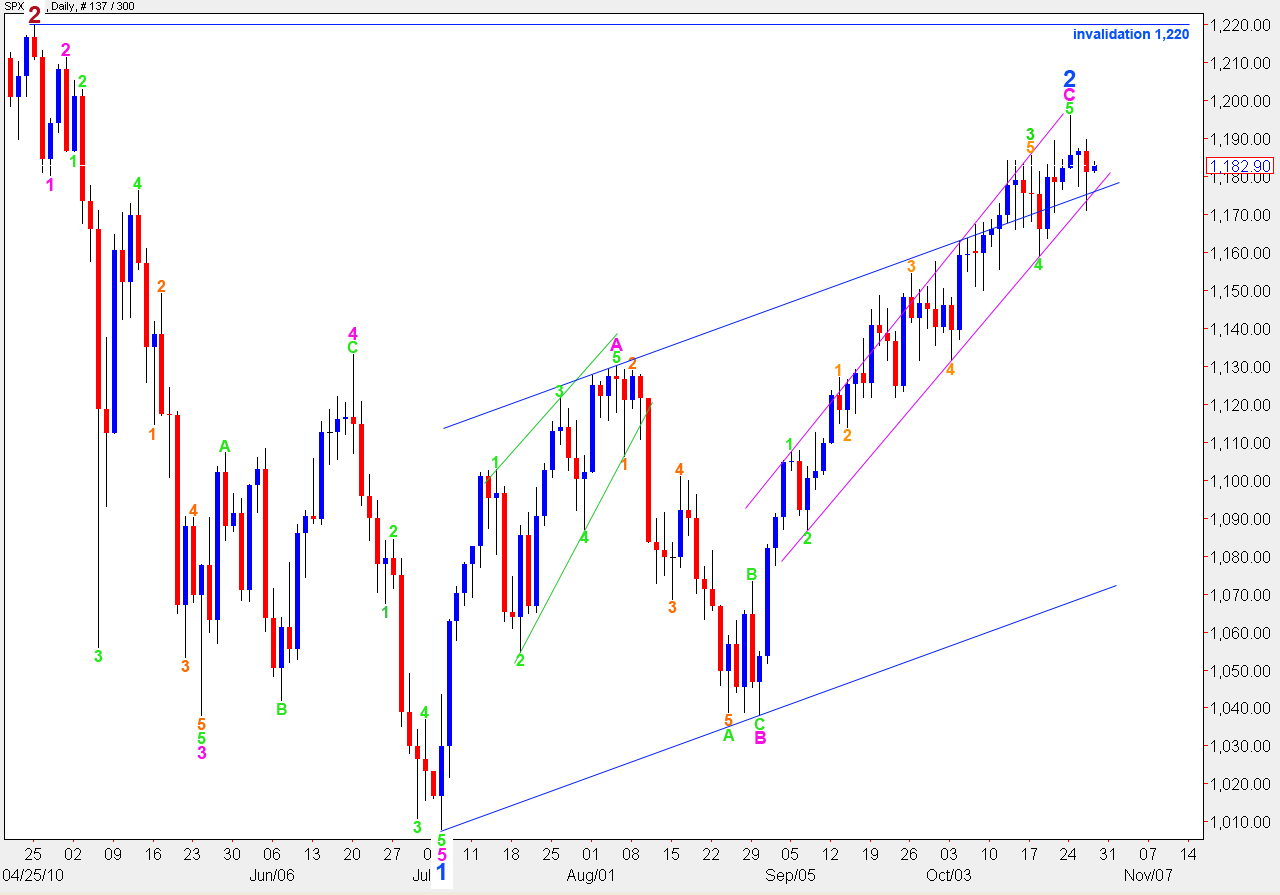
The S&P remains within the trend channel containing wave C pink. Until we have confirmation of a trend change, with a breach of this trend channel, we must accept the possibility of new highs. We must assume that the trend remains up, until proved otherwise. Therefore, I have two wave counts for you today.
Main Wave Count
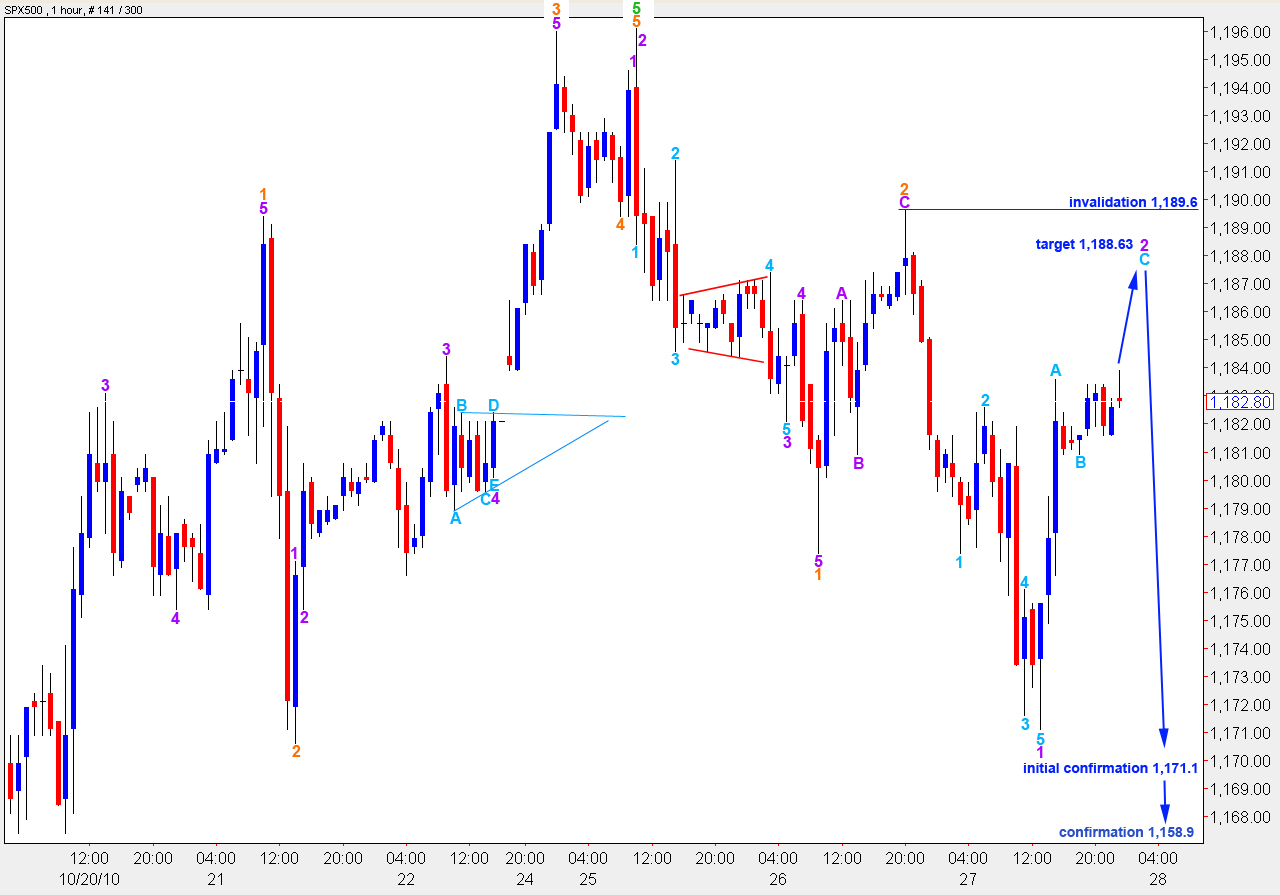
This wave count expects that we have a high in place.
If this wave count is correct then we should see strong downwards movement very soon.
Ratios within wave C pink are: wave 3 green is 13.7 points short of 1.618 the length of wave 1, which is not a very close fibonacci ratio. However, wave 5 green is just 0.4 points short of 0.382 the length of wave 3 green.
The trend channel drawn around C pink is Elliott’s technique. This channel has all of the ends of waves 1, 2, 3 and 4 touching the parallel lines. A trend line is first drawn from 1 to 3 and a parallel copy is placed on the low of 2.
We need to see a full candlestick closed and below the lower edge of the pink parallel channel drawn here around wave C pink to confirm a trend change from up to down.
With the deep correction for the 27th this wave count is looking a little less likely than yesterday. Unless wave 3 to the downside moves quickly below the low of wave 1 pink at 1,171.1 this wave count will not make sense. Third waves should be strong waves. However, we have to be open that at the moment it may be developing an extension.
Wave 2 purple is most likely extending further upwards. At 1,188.63 wave C aqua will reach 0.618 the length of wave A aqua.
Thereafter, a short term target for the end to wave 3 orange lies at 1,159.34 where it reaches 1.618 the length of wave 1 orange.
If we see movement above 1,189.6 this wave count will be invalidated. At that stage we should use the alternate wave count.
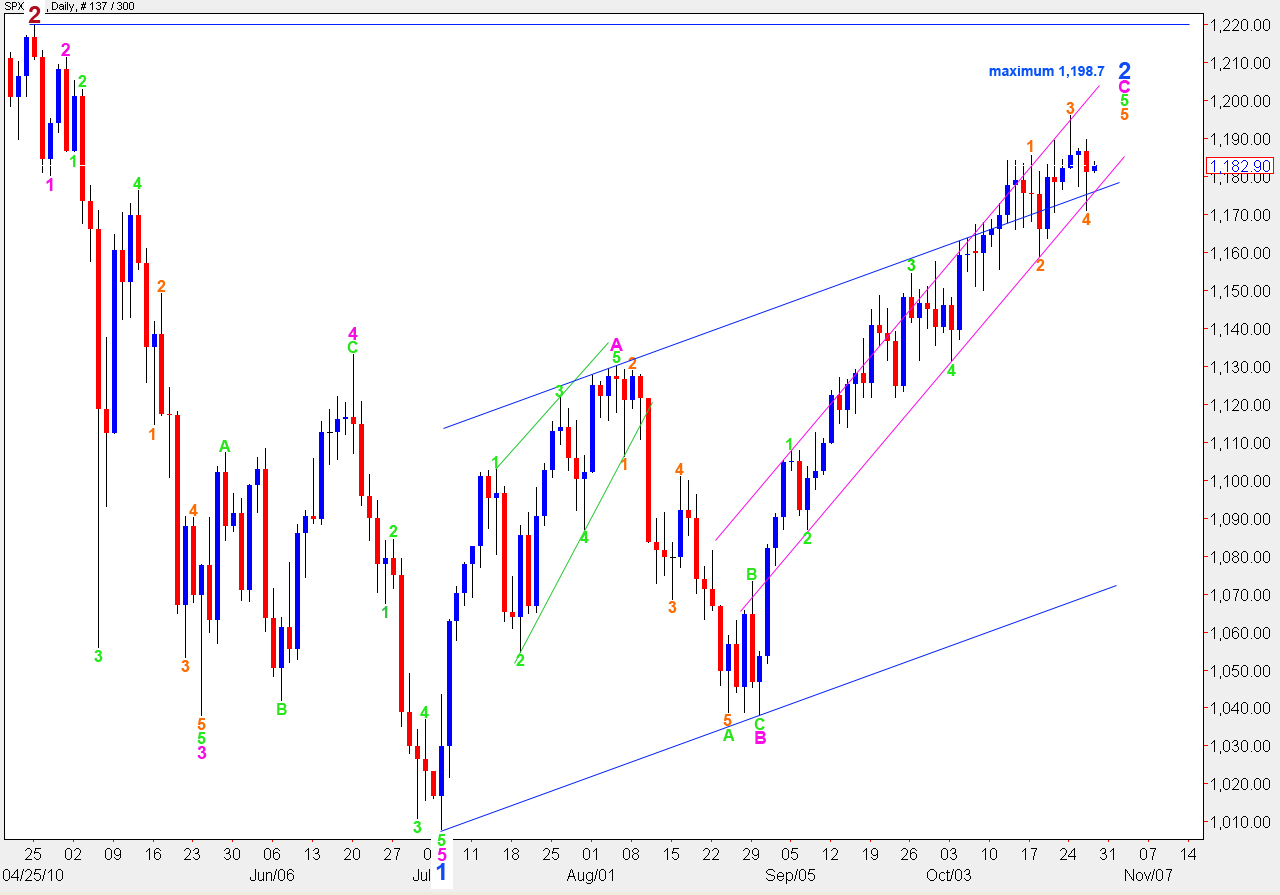
Alternate Wave Count.
Thanks to Sid Norris for pointing out this wave count to me.
It is possible to see wave 5 green as an ending contracting diagonal, with only wave 5 of that to complete.
Because wave 3 green is slightly shorter than wave 1 green this wave count has a maximum allowable upwards limit of 1,198.7.
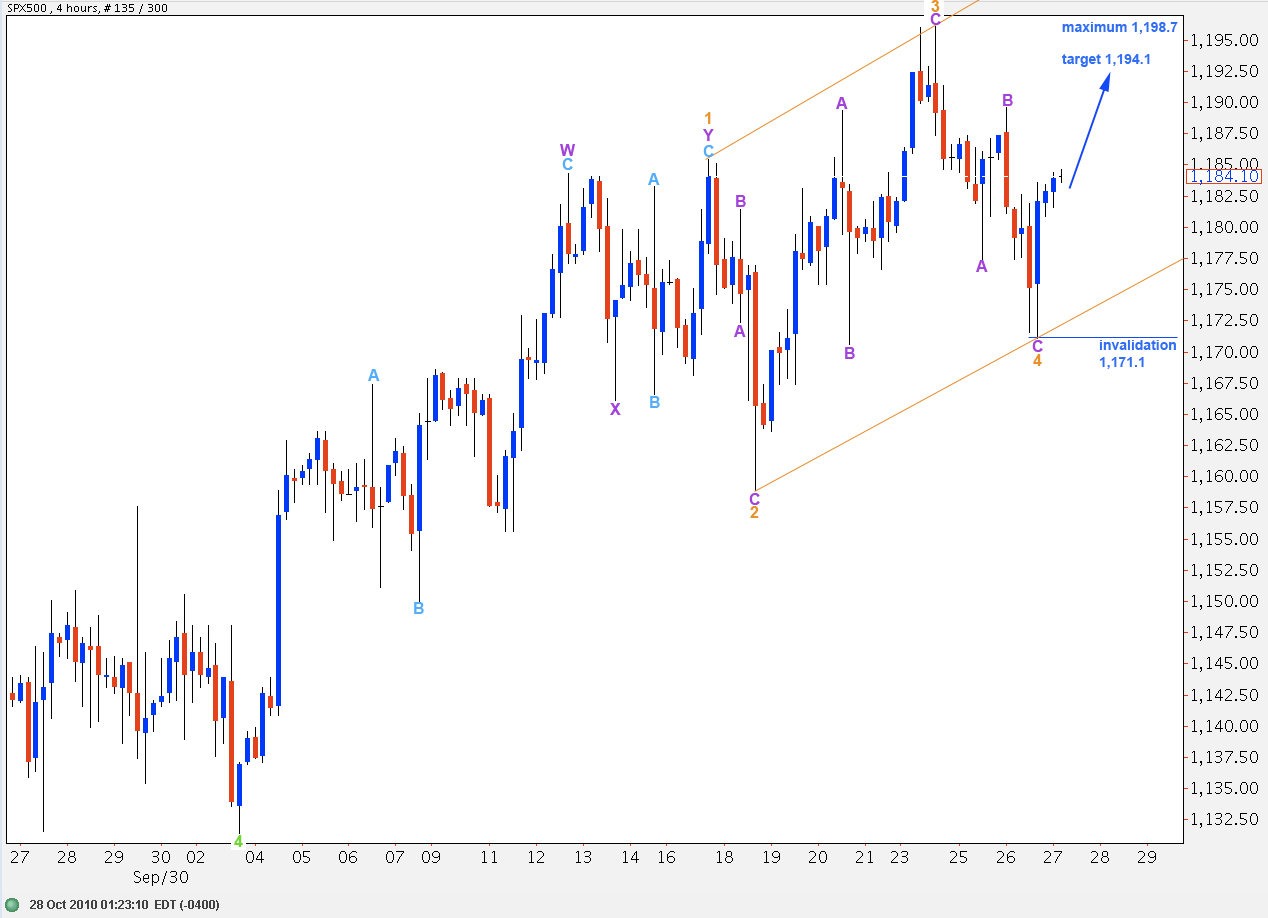
This wave count is shown on a 4 hourly chart to see all of this ending diagonal structure.
Wave 1 orange is a double zigzag correction. All subwaves of an ending diagonal must be zigzags.
Wave 4 is shorter than wave 2. Wave 3 is shorter than wave 1. Therefore, wave 5 cannot be longer than wave 3. Equality with wave 3 orange would take price above 1,198.7 which would invalidate this wave count.
If wave 5 orange reaches 0.618 the length of wave 3 orange it will end about 1,194.1 and will be truncated.
We only need one final zigzag to the upside to complete this wave count.
Movement below 1,171.1 will invalidate this wave count.
Looks like the alternate wave count could be playing out. Probably finished B of 5, and we are starting C of 5. If C=A, then target is 1195.53.
I came to learn that even when one is properly bearish at the very beginning of a bear market it is not well to begin selling in bulk until there is no danger of the engine backfiring. J. Livermore.
Thanks lara for the new wavecount. I like the alternate count structure.
Andrew and Louis, lets keep the comments here primarily on the wavecounts and EW, because lara does not like to clutter her mind with various news items. We can take up discussions on market news on the forums. I think a technician does a best job of analysing when his/her mind is not cluttered with news items that impact markets.
That’s true, although I really don’t pay any attention to any upcoming news events or politics. It’s all just so much noise. So you guys can say whatever you like, if it’s politics or economic news it really doesn’t register with me much. I’m so firmly of the belief that it’s the markets that drive the news, I find the news a sideline curiosity.
I have noticed however that sometimes in forex markets when we have news releases the markets volatile spikes tend to move price in a corrective direction, sometimes nicely hitting targets or fibonacci ratios, then bouncing right back off. So I like to be aware of (vaguely) when a news item is released, but I don’t care what it says.
News releases just seem to temporarily increase volatility, but the market pattern is unchanged. It’s going to do what its going to do no matter what the news release says.