
Elliott Wave chart analysis for the SPX500 for 26th October, 2010. Please click on the charts below to enlarge.
We still have two wave counts today. We do not have confirmation on the S&P of a trend change yet. However, the pound and euro have confirmed trend changes and the Dow is either going to invalidate its wave count at primary degree (unlikely) or has just turned downwards (more likely). Therefore, it is looking increasingly likely that we have already seen a trend change for the S&P.
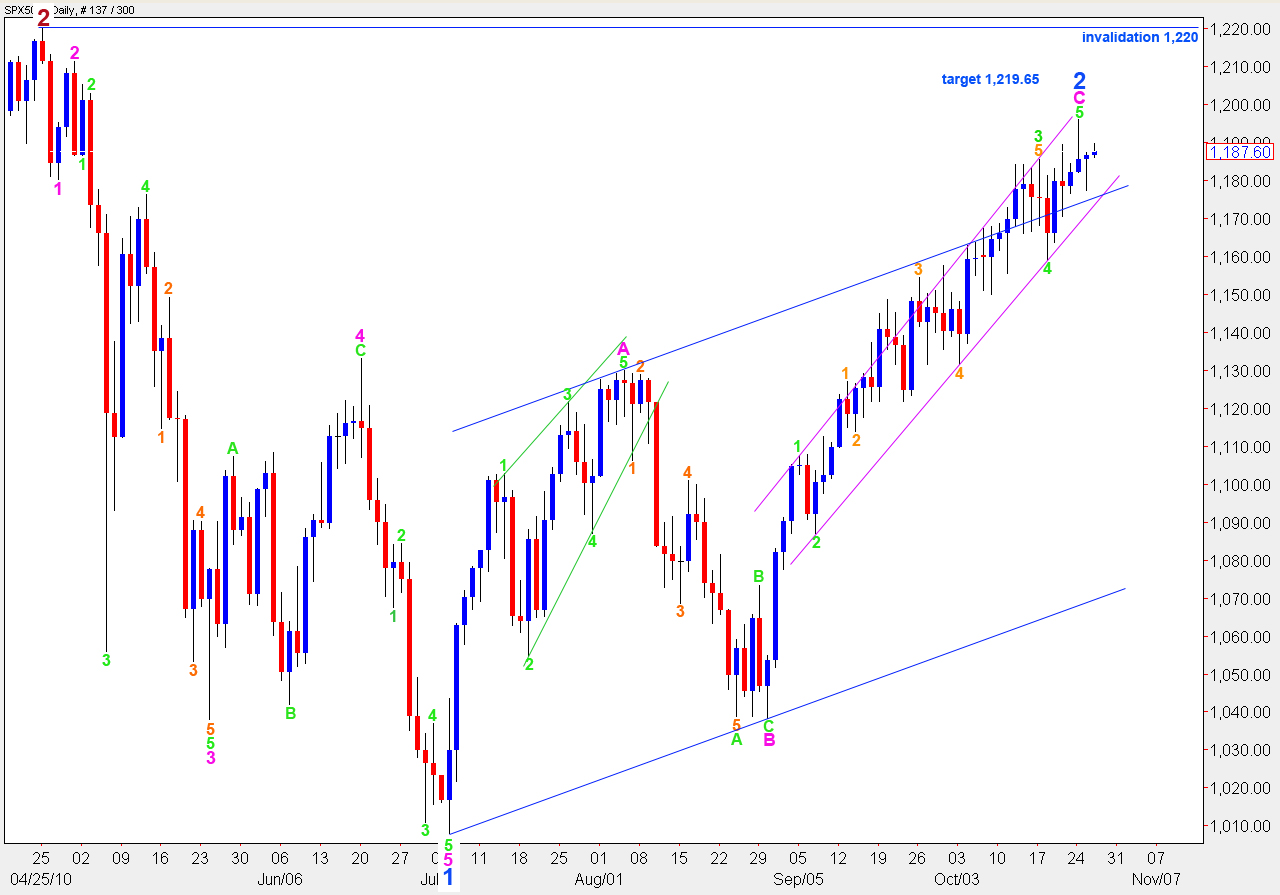
The trend change will be confirmed with a full candlestick sitting below the lower edge of the smaller pink parallel channel on the daily chart. Until the trend change is confirmed the possibility of new highs remains. Therefore, we should continue to consider a wave count which requires upwards movement and use confirmation and invalidation points to work with the two counts.
If we see a new high we may expect price to continue towards the target of 1,219.65. This is where wave 5 green will reach 0.618 the length of wave 3 green within wave 5 pink.
Any further upwards movement may not move above 1,220 as wave 2 blue may not move beyond the start of wave 1 blue.
We can see divergence with price trending up and MACD trending downwards on a 2, 4 and 8 hourly chart. This indicates an expiring (or expired) trend.
When the trend change is confirmed I will calculate downwards targets for you. To do so now would be premature.
Main Wave Count.
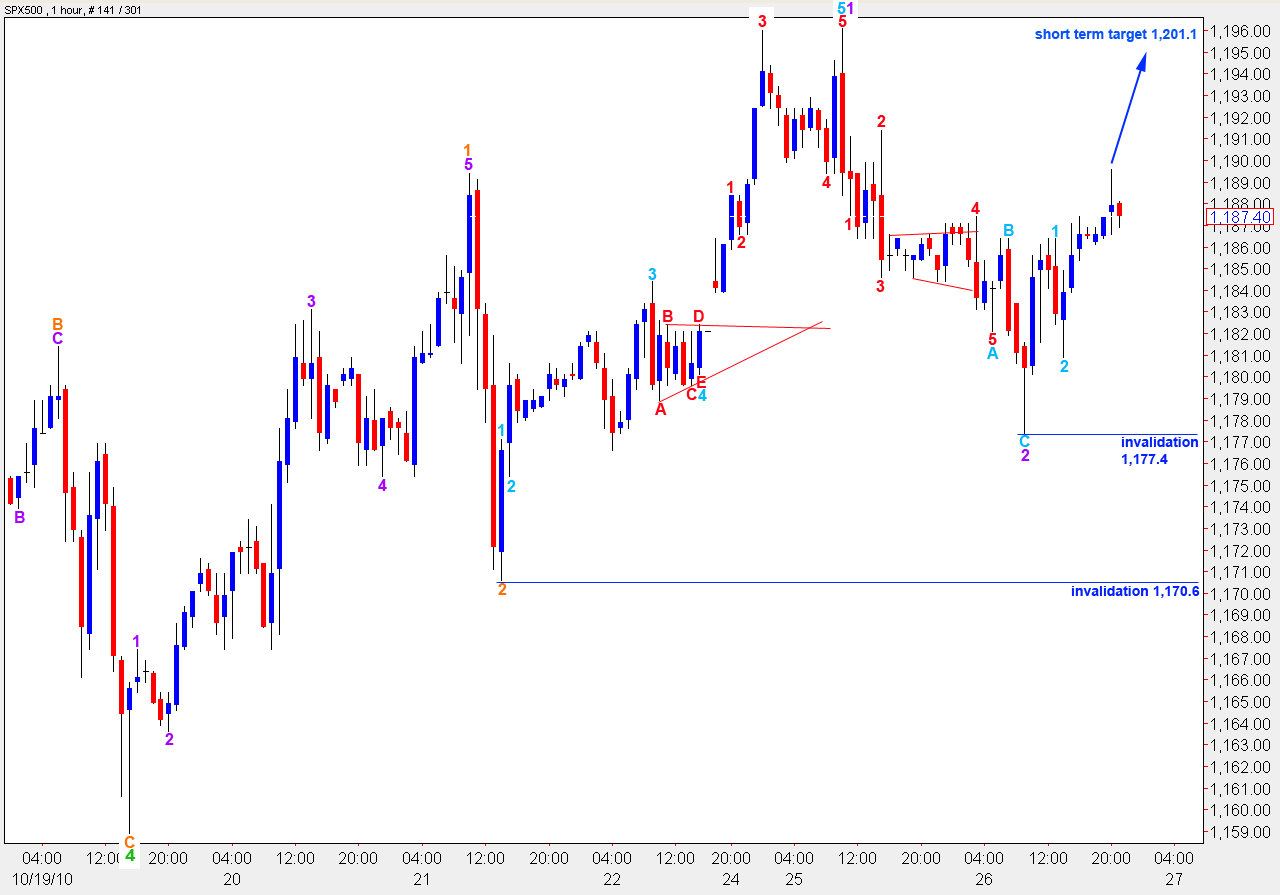
This wave count is looking less likely but it is still technically possible. If price moves above 1,196.1 we should expect further upwards movement towards the target.
At 1,201.1 wave 3 orange will reach equality with wave 1 orange.
Within wave 2 purple wave C aqua is just 0.3 points longer than 0.618 the length of wave A aqua.
Because wave 2 within wave 3 purple may not move beyond the start of wave 1 we should not see price move below 1,177.4. If this point is invalidated then labeling of recent movement is incorrect. This may be our first indication that this wave count at a larger degree is incorrect.
Movement below 1,170.6 will invalidate this wave count. At that stage any alternate wave count requiring upwards movement would require a lot of upwards movement to complete a satisfactory structure; that will be increasingly unlikely.
Movement below 1,158.9 will confirm a trend change. This would also likely take price outside the pink channel on the daily chart.
Alternate Wave Count.
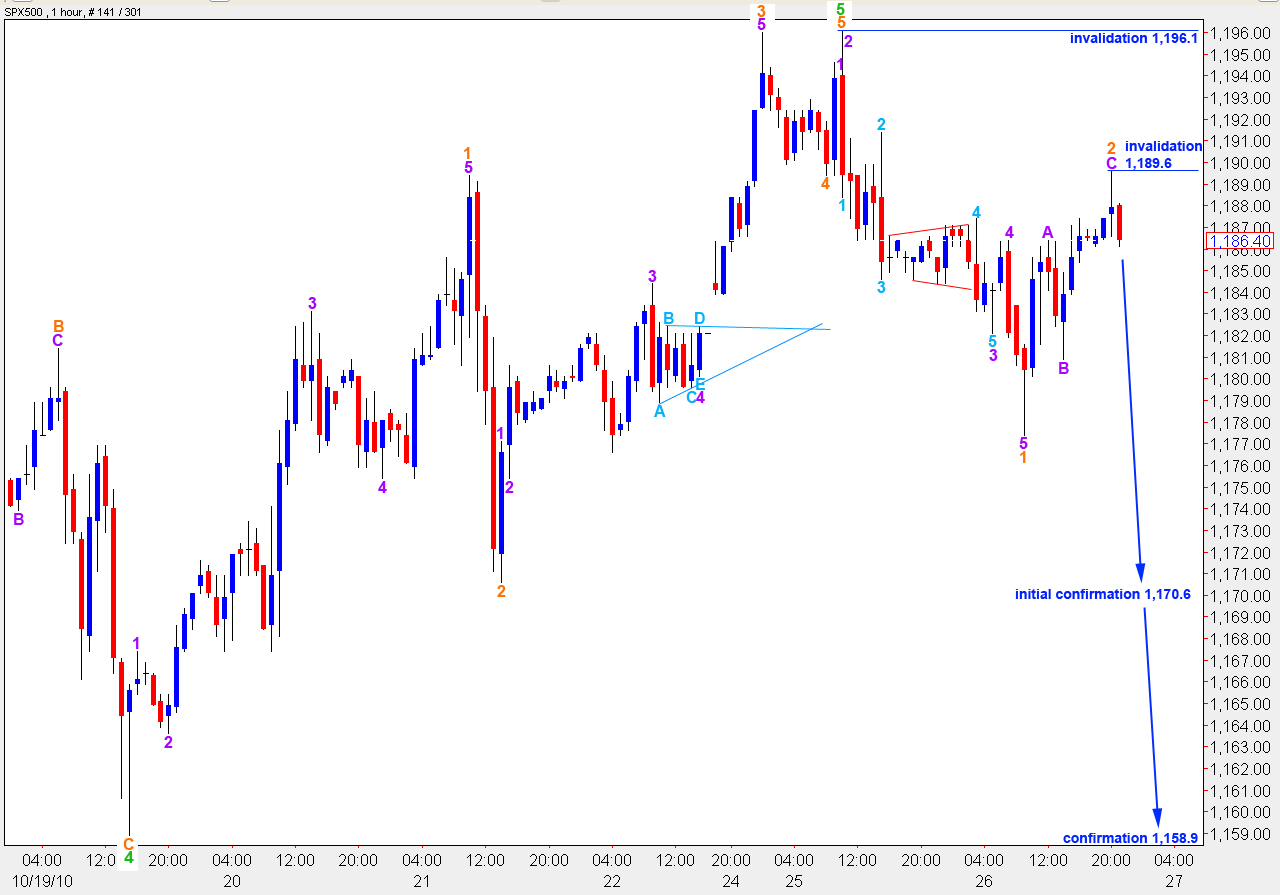
The labeling for wave 1 orange has been decided upon a 15 minute chart. Ratios within wave 1 orange are: wave 3 purple is 1.25 short of 4.236 the length of wave 1 purple and wave 5 purple is just 0.6 points longer than 2.618 the length of wave 1 purple.
Within wave 2 orange wave C purple is just 0.3 points short of equality with wave A purple.
If this wave count is correct then price should move below 1,177.4 as wave 3 orange must move beyond the end of wave 1 orange.
Movement below 1,170.6 will invalidate the main wave count and confirm this one.
Finally, movement below 1,158.9 will invalidate other less likely alternate wave counts which allow for new highs. At that stage we may consider the trend change as having occurred.
We should not see price movement above 1,189.6 as any second wave correction within wave 3 orange may not move beyond the start of the first.
yea im not getting in any positions before the announcement either. I am already kinda brainstorming about how its going to fit in the EW count though.
For example: Let’s say we continue to decline untill the announcement and we make a minute 1 wave. If theres a positive reaction (at first) to the announcement that could be the wave 2. This might be an ideal moment to short into if it moves close to the invalidation point.
Hi Lara, Loving the analysis – Typical I’m on a short break this week – I was wanting to catch the highs but looks like I’ll have to wait until next week – still managing to watch the vids though! QE2 looks like it could be the factor that tips the markets, just looking at fed meeting date and where the market is at. QE2 was meant to be the saviour of ALL lol – unless Mr B is set to disappoint!
Take care
Andrew
Lara,
Since i have not seen your usd analysis in a while i wonder if you have seen confirmation in USD index. Since you say there is confirmation of trend change in EUR/USD, this is major news. Have both EUR and GBP produced candles outside the trendlines you draw ? We have not seen any signs in the markets yet, but you can see the asia market is down for wednesday.
I’ve had confirmation on the pound for a few days. For the euro, it invalidated a wave count which allowed for more upwards movement therefore the alternate trend channel is now correct and it’s very clearly breached. When I update the dollar I expect that will also show a very clear breach. I’m managing to update the dollar and dow weekly, and I hope to have more time to do it more regularly when I’m back home in New Zealand.
Now New York has opened and we can see a breach of 1,177.4. The wave count requiring further upwards movement is looking less and less likely.
I can see another alternate where the high of wave 1 within this terminal 5 green is at 1,173.4. If we break below this point, because four cannot move into 1 (and as 1 would be an impulse this could not be an ending diagonal) this alternate would also be breached.
As that is the lowest point I could see wave 1 being placed a breach of this point would make further upwards movement look so much less likely, the wave count for it then gets too forced.