
Elliott Wave chart analysis for the SPX500 for 22nd October, 2010. Please click on the charts below to enlarge.
We still have two wave counts to end the trading week. Both are technically valid.
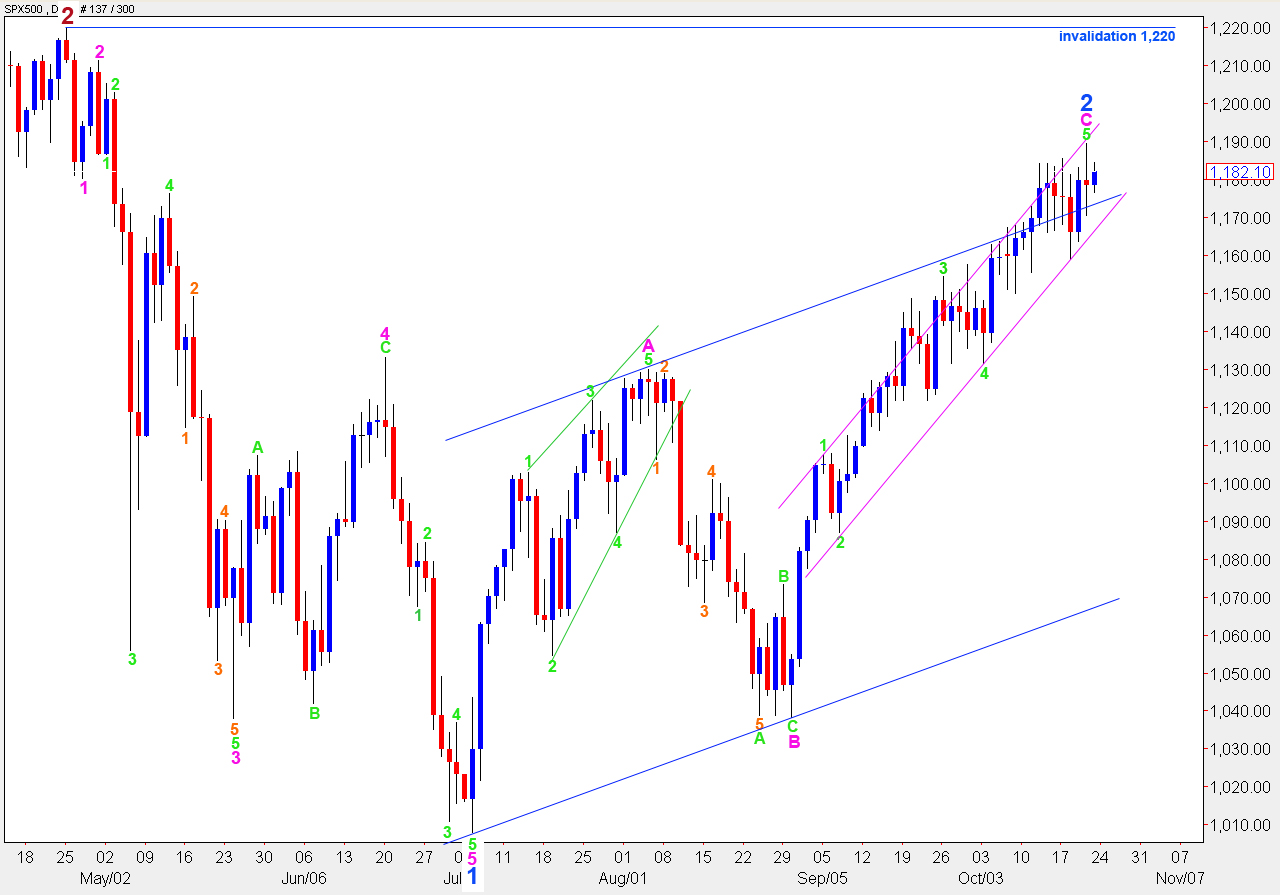
Main Wave Count
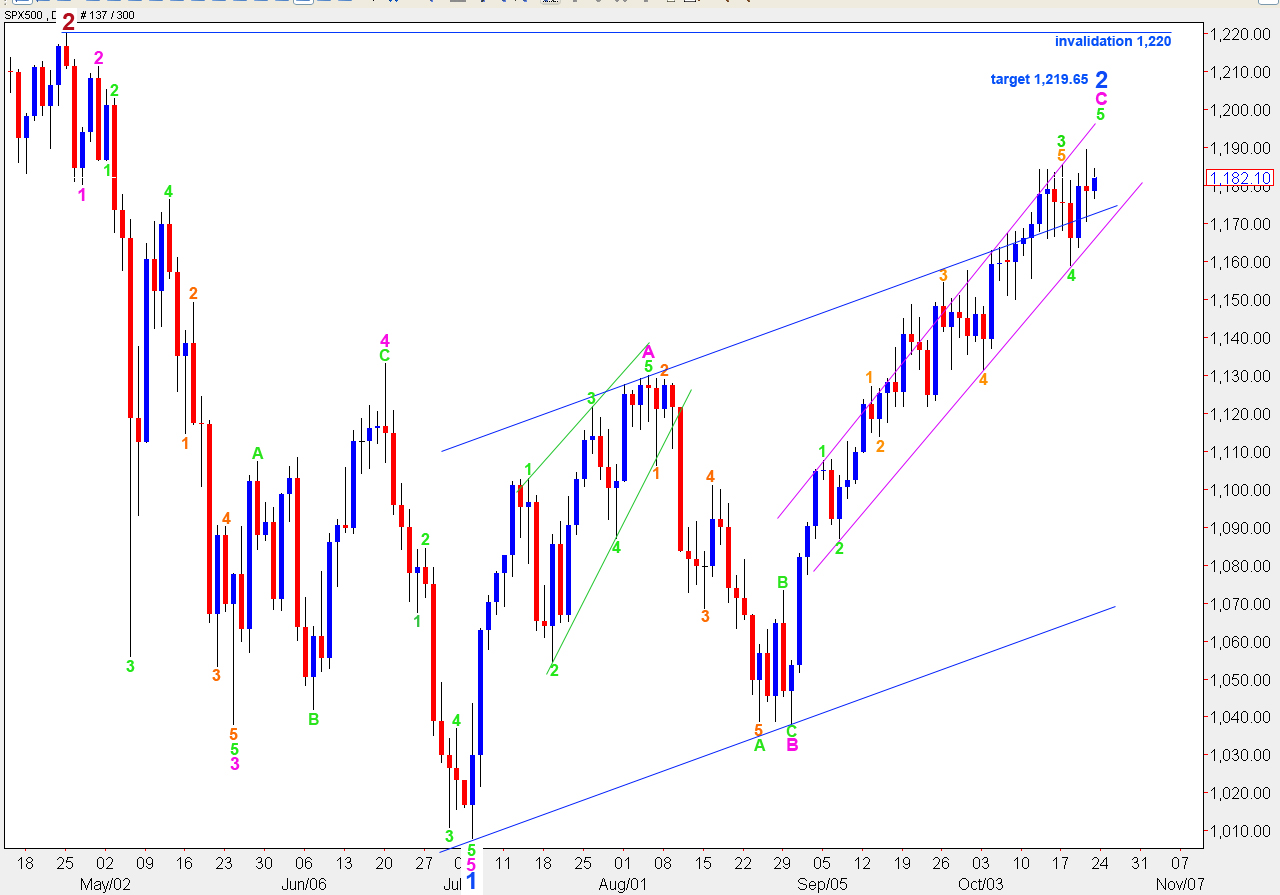
We are still expecting a little more upwards movement to end wave 2 blue. I have recalculated the target for you today. At 1,219.65 wave 5 green will reach 0.618 the length of wave 3 green.
We will still use the pink parallel channel drawn using Elliott’s technique around wave C blue. When we see price move below the lower end of this channel we may have seen a trend change. When we have a full candlestick closed outside the lower edge of this channel then we will have confirmation of a trend change. Until we have that confirmation we must continue to assume the trend remains up. However, we are much closer at the end of this trading week to the end. Exercise extreme caution at this stage because when downwards movement begins it could be very fast.
On Thursday, November the 4th, wave 2 blue will have lasted a fibonacci 89 days. We may see a trend change at this date, give or take two trading days either side. Therefore, we may see the start of the next wave down on Tuesday the 2nd of November to Monday the 8th of November. We must be very cautious on these dates.
If downwards movement begins explosively it may be difficult to access trading accounts. It could be very costly to your account if you were holding unprotected long positions and you may not be able to enter shorts.
Another possibility is that we see mostly sideways movement drag this out for another week or two. We will see.
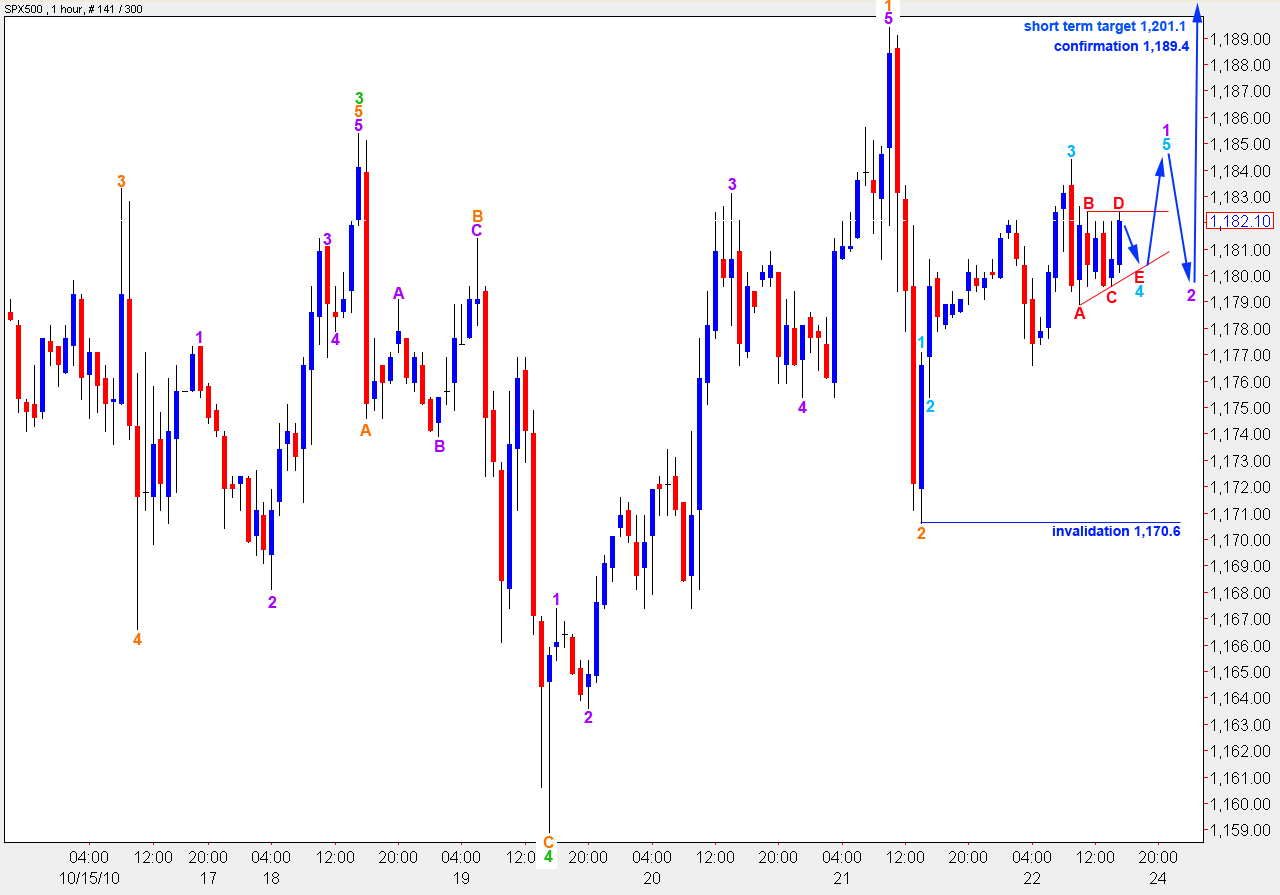
This wave count expects further upwards movement which should be a third wave at this stage. Wave behaviour is not conforming to this expectation; there is too much sideways movement to be a third wave. However, it could redeem itself with some strong upwards movement as it moves into the middle though.
A nice triangle is forming, for this wave count, in a fourth wave position. We may expect wave E to come down a little lower but not move beyond the end of wave C at 1,179.6. Thereafter, we should expect a short sharp thrust to the upside which is likely to be about 5.5 points long.
Thereafter, a downwards second wave should unfold which cannot move beyond the start of wave 1 purple; this is our invalidation point at 1,170.6. This second wave correction may only correct to about the fourth wave of one lesser degree though, which may be about 1,179.8.
If we extend the trend lines of the triangle out towards the right, they cross over about 3pm for Monday the 25th trading session. Look out for a trend change at that time. This tendency of markets to see a trend change at the apex of triangle trend lines is a tendency and not definitive.
At 1,201.1 wave 3 orange will reach equality with wave 1 orange within wave 5 green. This is our short term target for this wave count.
If price moves below 1,170.6 then we should use the alternate wave count presented below.
Alternate Wave Count
This wave count sees a high in place and the trend change to down having occurred. This trend change will be unconfirmed, however, until we can see a full candlestick outside and below the pink parallel channel containing wave C blue.
I shall not calculate targets for the downside until the trend change is confirmed. To do so at this time is premature.
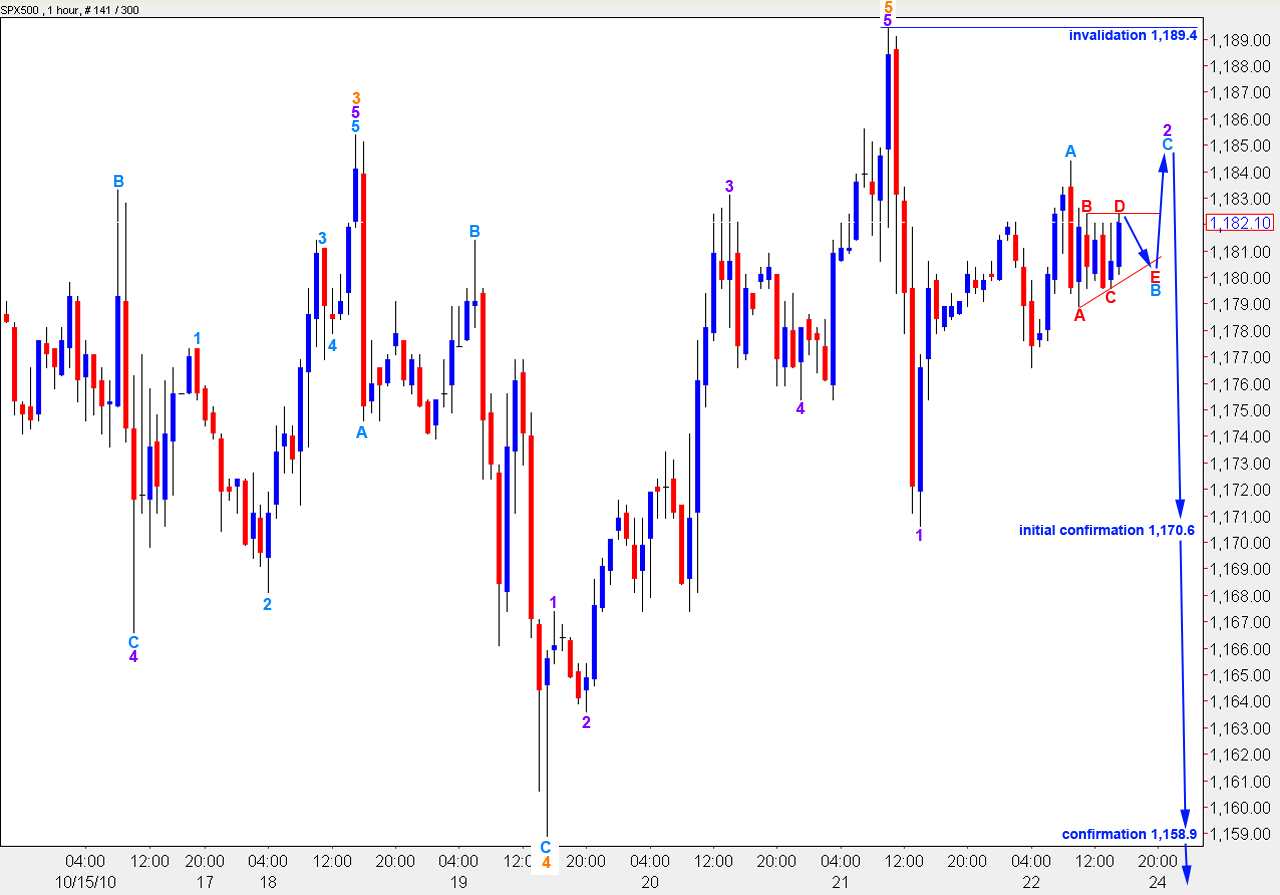
We may be seeing a leading diagonal develop to the downside. A leading diagonal requires waves 2 and 4 to subdivide into zigzags while waves 1, 3 and 5 may subdivide into impulses or zigzags. Here, wave 1 purple is a zigzag.
If this wave count is correct wave 2 purple should not move beyond the start of wave 1. Therefore, price cannot rise above 1,189.4.
It is likely that for the first few hours of Monday’s trading session the triangle structure will complete with wave E down, then an upwards thrust about 5.5 points in length will complete wave 2 purple.
Thereafter, price should again turn down. This wave count expects a third wave down which must move beyond the end of wave 1. Therefore, price must move below 1,170.6. This will confirm this wave count. This is also the invalidation point for the main wave count.
Movement above 1,189.4 will invalidate this wave count and confirm the main wave count. At that stage we may expect price to continue higher towards our targets, with a lot of sideways movement along the way.
Lara,
I think you may have been asked this already, but it appears that the Dow is likely to break the April high of 12,254 (it has come within 10 points twice, including today).
If the Dow breaks 12,254, then we are still in P2 for the Dow. Doesn’t that suggest that the S&P will soon take out 1220? If not, is there a count for the Dow that allows a small move above 12,254 before starting P3?
Thanks,
Peter
If the Dow invalidates the count by moving above 11,254 then it is highly likely that the SPX500 will also move above it’s invalidation point at 1,220, yes.
It still could move above these points a little before starting P3, yes. And as the upwards trend for both markets is exhausting itself at this time we should not expect a long sustained rise from them if they do invalidate their wave counts.
The likelihood that movement will be seen above these points is however lower than the likelihood of a reversal before these points are reached.
The NDX clearly has a different historical wave count for instance it did not make a lower low in march 2009.
i would be more worried if the Dow invalidates though. but we’ll see.
Louis – looking at monthly charts of the NAS100 and SPX500 I agree. Their wave structures are very different at primary and cycle degree.
If the Dow breaks through 11,254 then it has invalidated its wave count. Then my alternate would see what I have labeled Primary 2 as just A of primary 2, which would then be a five wave structure and P2 would be a zigzag. The next invalidation point then would have to move right up to 13,137 for the Dow. From a subdivision of waves this count may actually fit well, but for wave behaviour it would not. We would then have that strong downwards movement labeled now minor 1 as a B wave, which really does not fit well at all!
Good question mike. Someone else was asking about that in the forums. NDX has already passed over april highs , and dow jones is very close to it and we might invalidate the april highs this week. This is a tough situation to evaluate.
I’m going to have a look at the historical count tomorrow. I’ll have a better answer for you then.
Hi Lara. If we were to see new heights in price on the SPX, could we still be in a massive corrective wave that will still see a pull back down into the 800’s, but then take on a different form thereafter? Or, do you see it as a 3rd wave top in one final five wave move to highs well above these levels that will really mark the top of Primary 2?
Sorry, but the what ifs are glaring me in the face as the wave counts and price targets keep moving up the ladder closer to 1220.
Also appears that DJIA will easily make a new high based on SPX projections. What happens to its count should that eventuality occur?
Thanks, Mike
Yes of course. This is a second wave correction. Second waves can correct right up to the start of the first. They are often deep corrections. This is conforming to that tendency. In hourly charts I often see second waves correct right up to the start of the first, creating a perfect double top or double bottom.
The deeper the correction the longer wave 3 will be that follows it.
I’m going to take another look at my historical count. At this stage all indicators point to an extremely over extended rise. Each successive upwards rise is less convincing. This upwards trend is expiring.
When I’ve taken another look at my historical count then I can answer your last point. But I don’t want to give you a poorly considered shallow response so I’ll just say today that I’ll get to that tomorrow morning after a good night’s sleep.
At this stage I don’t think the Dow is going to make a new high. I think the S&P and Dow are extremely close to turning.
I know the targets keep changing, unfortunately that’s the nature of EW. We have not yet had a top confirmed however, and as I keep saying until proved otherwise expect the trend remains the same – up.