
Elliott Wave chart analysis for the SPX500 for 20th October, 2010. Please click on the charts below to enlarge.
After hours movement has invalidated the main wave count with a very slightly new high. At the time of this analysis the new high was 1,185.6.
I have re-analysed the alternate wave count again. It remains valid but I’m returning to another alternate we have used before which may be more probable. This wave count does not require significant upwards movement.
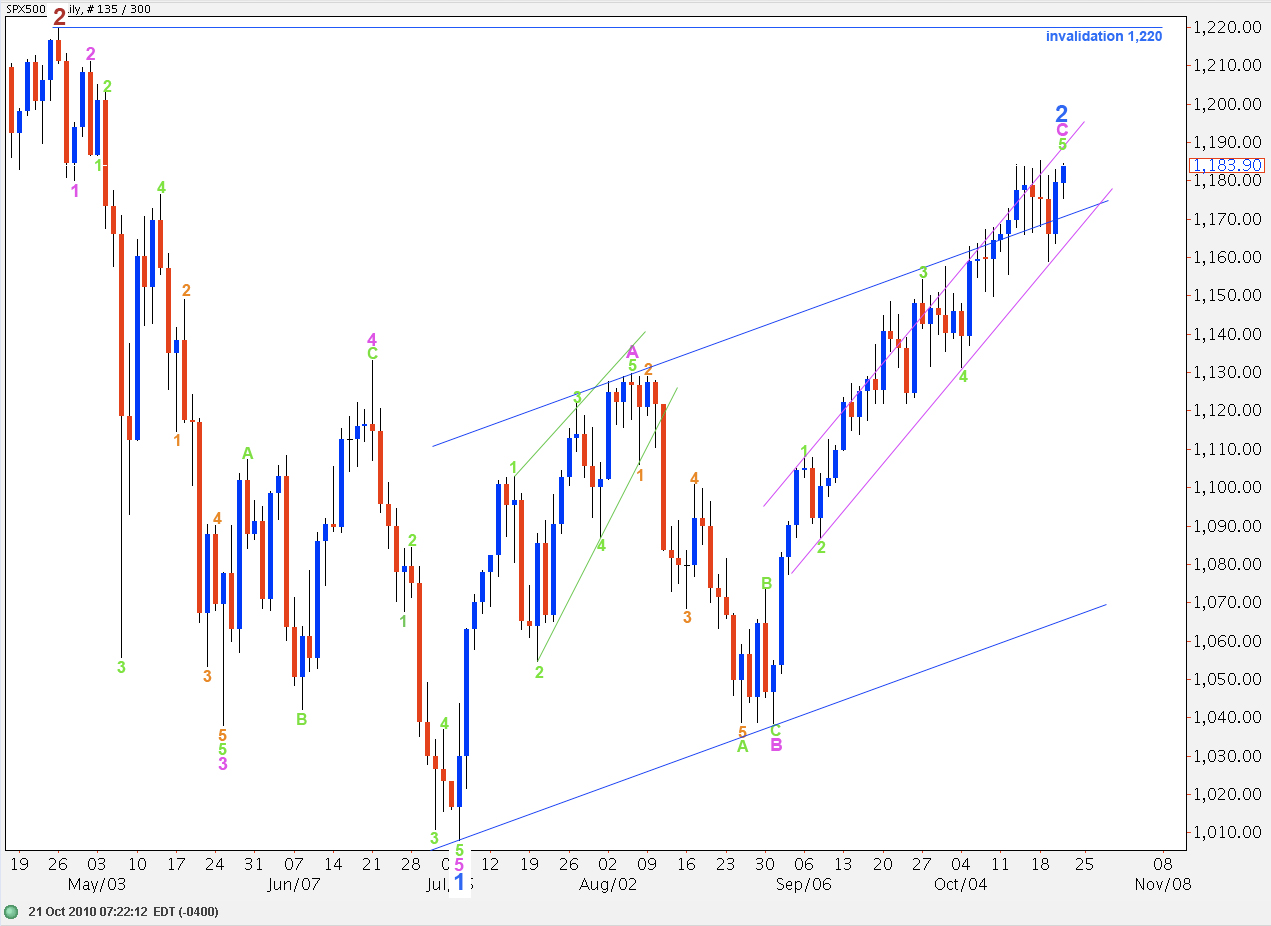
With a new high on the 20th of October wave C pink can now have no fibonacci time relationship. If upwards movement continues, slowly, the next opportunity for a fibonacci time relationship will be on the 5th of November, where wave 2 blue will last a fibonacci 89 days (give or take 2 days either side of this date).
Wave 5 green cannot be longer than wave 3 green and because wave 3 green is slightly shorter than wave 1 green, and wave 3 cannot be the shortest, upwards movement is limited to no higher than 1,198.7 for this wave count.
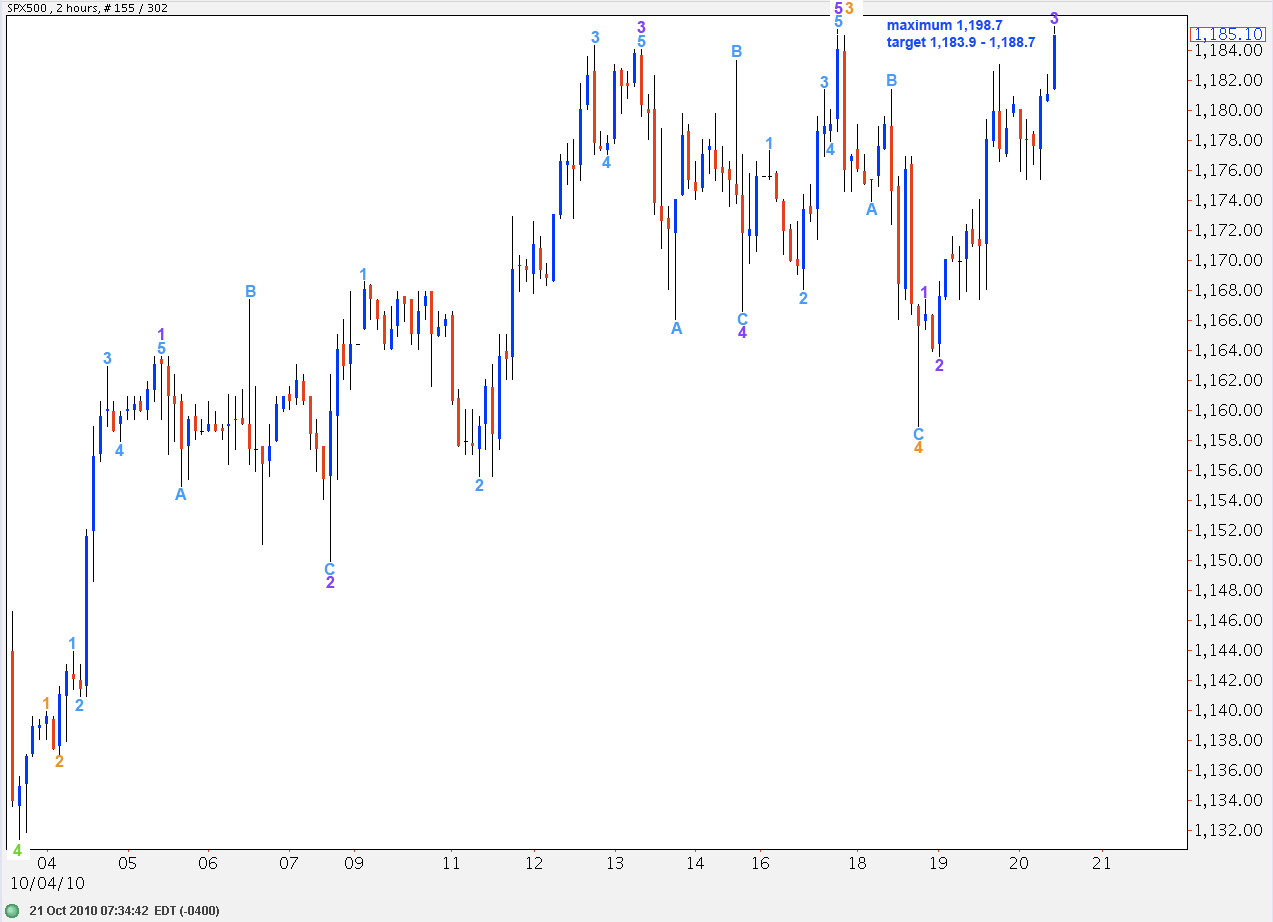
This 2 hourly chart details all of wave 5 green from its start at 1,131.4.
There is no fibonacci ratio between waves 1 and 3 orange. At 1,188.7 wave 5 orange will reach 0.618 the length of wave 3 orange. This is the upper end of our target zone.
This wave count meets all rules and many guidelines. I do not like the very small length of waves 1 and 2 orange in relation to waves 3 and 4 orange, although first and second waves of an impulse can be brief. Within wave 4 purple there is a slightly truncated C wave and also to end wave 3 purple wave 5 aqua is slightly truncated. Wave C aqua to end wave 2 purple can be seen as a five wave structure on a 15 minute chart, but this count at this small point seems forced.
Overall this wave count is the best fit I can see for recent upwards movement. Yesterday’s alternate remains valid so we should keep in mind its implication: that price has further upwards to go to end this upward trend. However, the limit of 1,198.7 remains the same.
Wave 3 purple is just 2.8 points short of 2.618 the length of wave 1 purple.
At 1,183.9 wave 5 purple will reach equality with wave 1 purple. This is the lower end of our target zone.
Upwards movement cannot move above 1,198.7.
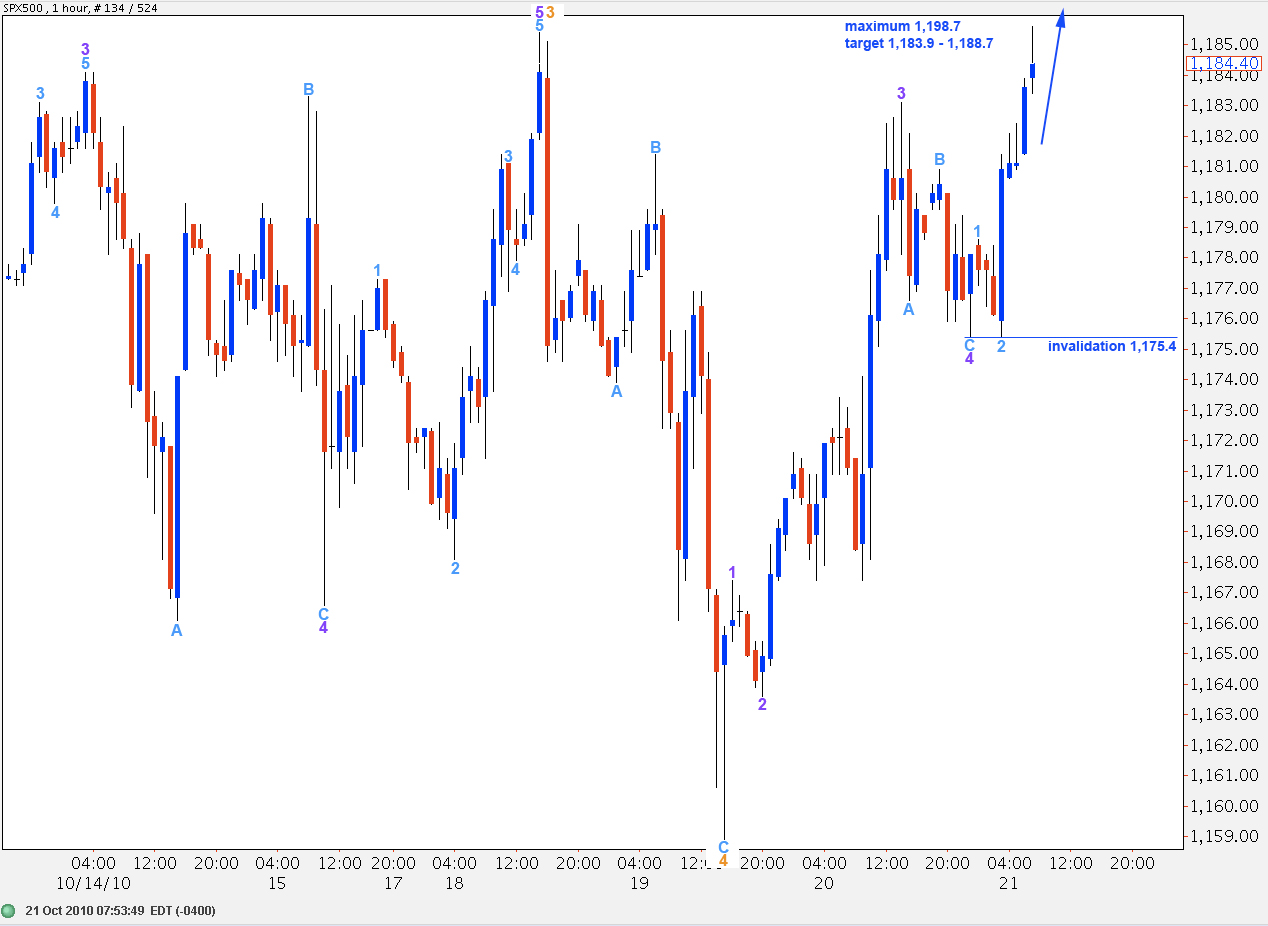
Within wave 5 purple to the upside we have probably just finished the third wave. We should have one more push upwards towards the target zone to end this fifth wave before price turns back down.
The highs are getting shallower. There is still divergence between price trending higher and MACD trending lower.
With this wave count our important price point to confirm a big trend change returns to 1,131.4. We still need confirmation of a trend change by a breach of the trend channel on the daily chart. When we can see a full candlestick outside the lower edge of the pink parallel channel on the daily chart then we will have confirmation of a trend change at minor degree. This will likely come before price moves below 1,131.4.
Guys,
Notice how you could have used lara’s charts today. Todays high and low are exactly marked by the trendlines lara has drawn. Top is the pink channel and bottom is the blue trendline she has drawn from couple of months ago. I noticed it only now upon close study…. today would have been a awesome day for day trading.
Thanks lara. I like the 1158, and i like the idea of watching for the pink channel breach. Keeping in view, this channel importance, would your charting software allow to find the approximate upper & lower target of the channel everyday ? I keep your charts handy, for reference as i look at market everyday. Since the pink channel is missing in the hourly charts, its hard to figure what this channel resistence/support are. It would help those of us here, who are jittery, to keep a eye on this channel on a daily basis. If we have a crash suddenly, just a 3% might take out this channel in one single day. For example, on tuesday both ends of this channel were tested. Even though this is not to be used for entering short positions, it might protect those of us, who are currently long, to cut short the losses. Can i request inclusion of the approximate channel resistence/support in the intraday charts OR on the main daily charts ? I use both of them everyday in trading. Thanks much.
Around the 5th of november sounds very good as 2nd of november is the FOMC meeting announcement (where they might or might not announce QE2 ) and the US midterm elections. That is going to be a wild week.
Lara,
As the market trends higher, dont we get a trend change validation higher than the 1131.4 ? Have the recent developments given a clue about where we can rise this point upto ?
You could have an alternate with green 3 and 4 higher, which would have the confirmation price point at 1,158.9. I’m being very conservative in leaving it down at 1,131.4.
This other alternate I’ve charted sees price moving right up to 1,220. So this is entirely possible.
In practice however the trend change confirmation will come with a channel breach to the downside, with a full candlestick below the channel. It’s vital that we wait for the candlestick to be over and closed and still outside the channel before we consider we have confirmation of a trend change. This will come before price reaches down to 1,131.4. So this price point is the most conservative final confirmation, but I place great weight on Elliott’s channeling technique and use of this to confirm trend changes. So far it’s working for us well.