
Elliott Wave chart analysis for the SPX500 for 19th October, 2010. Please click on the charts below to enlarge.
Today I still have two wave counts for you. Today’s main wave count expects we have seen a minor degree trend change. The alternate wave count is looking less likely today.
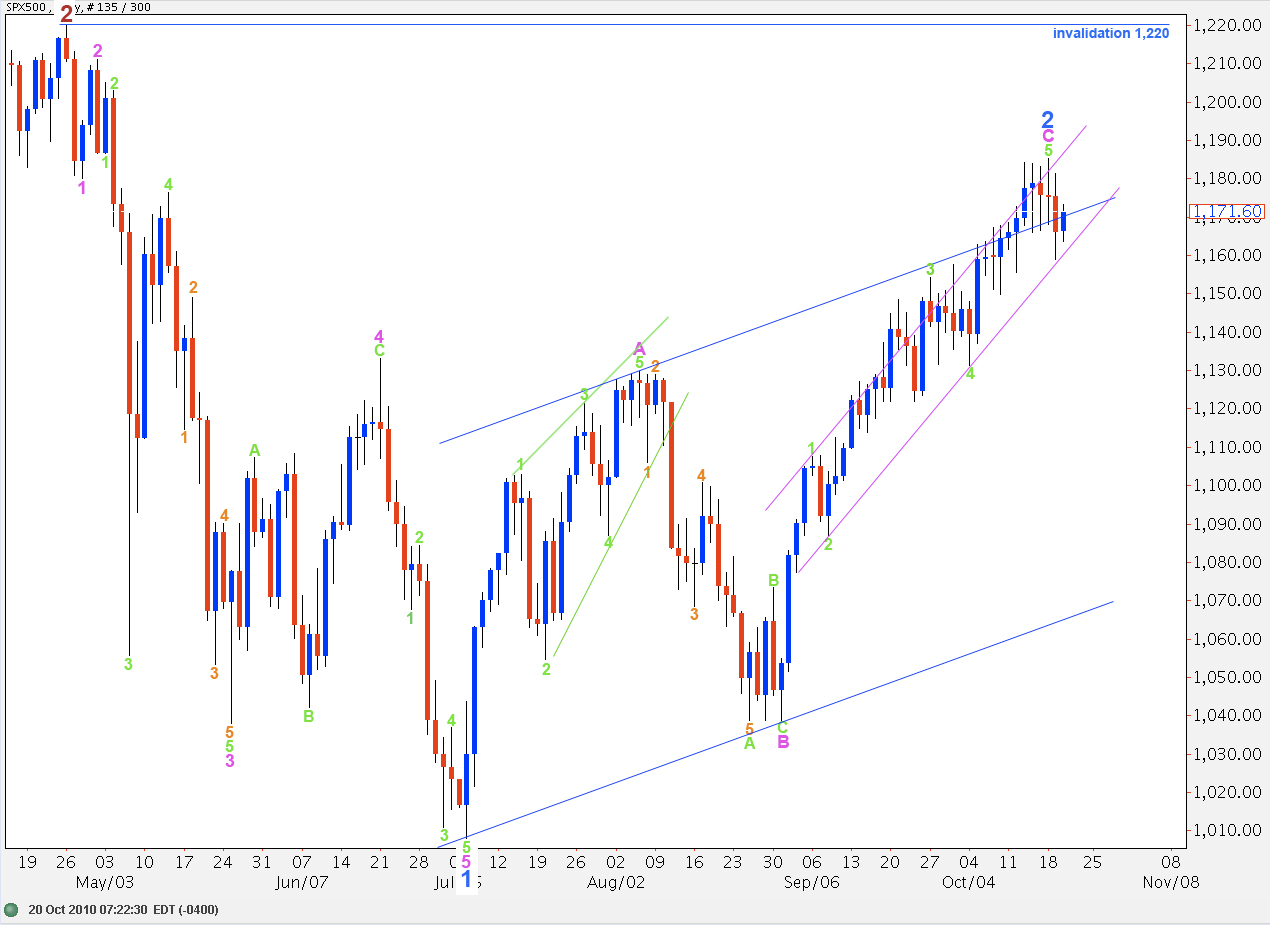
It is looking increasingly likely that we have seen a minor degree trend change and the S&P is in the very early stages of a third wave down. However, price remains within the pink parallel trend channel on the daily chart. This trend change is unconfirmed. We must assume the trend is up until proved otherwise. At this critical juncture there is great risk to trading the S&P to the upside today.
If wave 2 blue is over then wave C pink lasted 35 days, just one more than a fibonacci 34. It has no fibonacci price ratio to wave A pink.
Within wave C pink ratios are: wave 3 green is just 1.9 points short of equality with wave 1 green and wave 5 green has no fibonacci ratio to wave 1 green.
We still need confirmation of this trend change to have confidence in short positions. When we can see a full candlestick below the lower edge of the parallel channel drawn around wave C pink we shall have this confirmation.
Main Wave Count
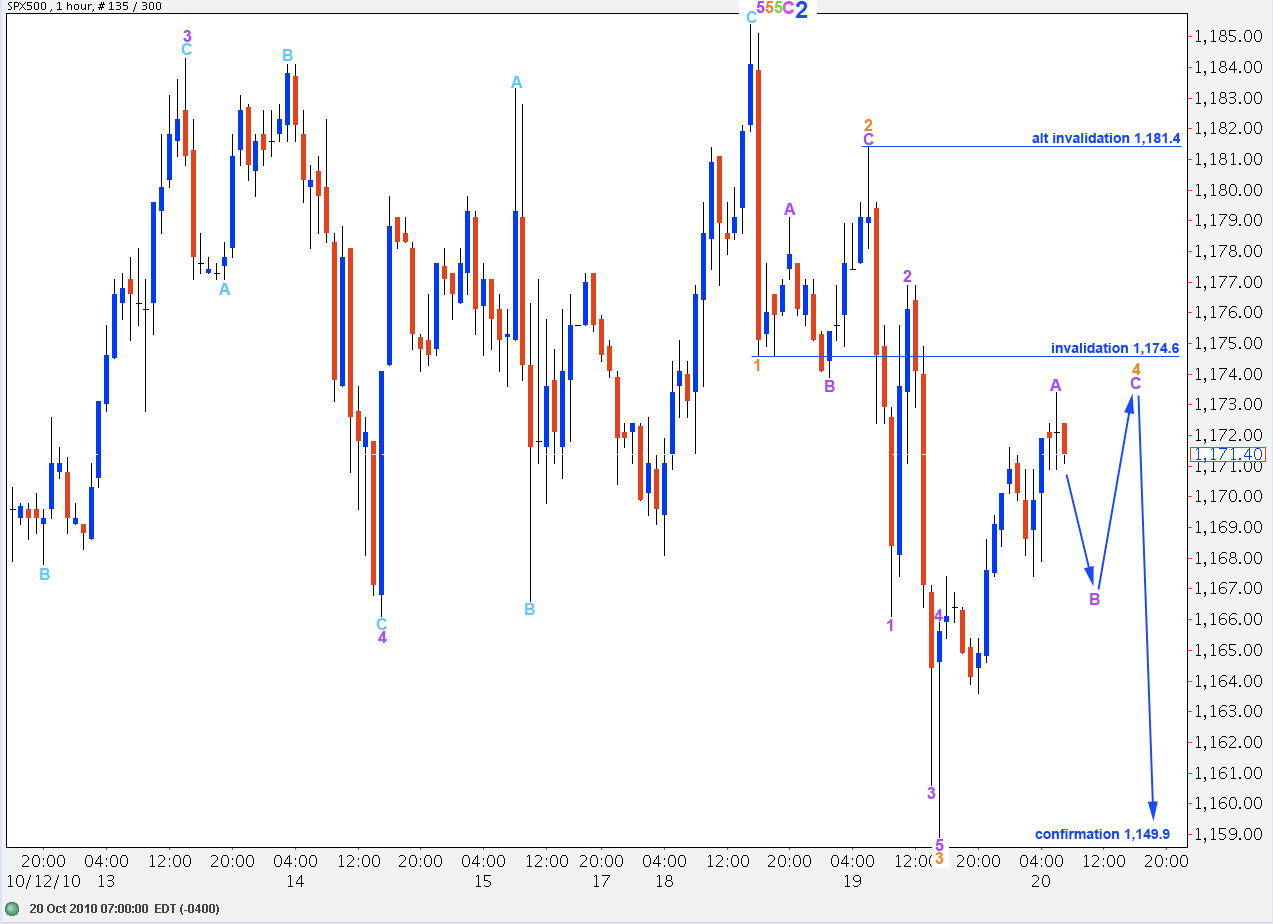
Wave 5 green ended in an ending expanding diagonal for wave 5 orange.
Within downwards movement wave 1 orange has a very good five wave structure when viewed on a 15 minute chart. Wave 3 orange also is a clear five on a 15 minute chart, with wave 4 purple within it touching the end of wave 1 purple.
Ratios within wave 3 orange are: wave 3 purple is just 1 point longer than equality with wave 1 purple and wave 5 purple is just 1 point short of 0.382 the length of wave 3 purple.
Upwards movement is a clear five wave structure but its behaviour differs from previous downwards movement. This upwards movement is most likely an A wave.
Therefore, the S&P should open Wednesday’s New York session with a little downwards movement in a three wave structure that cannot reach beyond the start of wave A at 1,158.9. Thereafter, another five wave structure upwards for wave C purple will end wave 4 orange.
Wave 4 orange cannot move into wave 1 orange price territory. Therefore, price should not move above 1,174.6.
The next movement should be again down for a fifth wave which is most likely to end below the end of the third at 1,158.9 and is most likely to be at about 22.5 points in length.
If this first price point is invalidated then we need to move the degree of labeling for waves 3 and 4 orange down one degree and relabel them a first and second wave. If this interpretation is correct then price should not move above 1,181.4. Therefore, this is our alternate invalidation point.
Alternate Wave Count
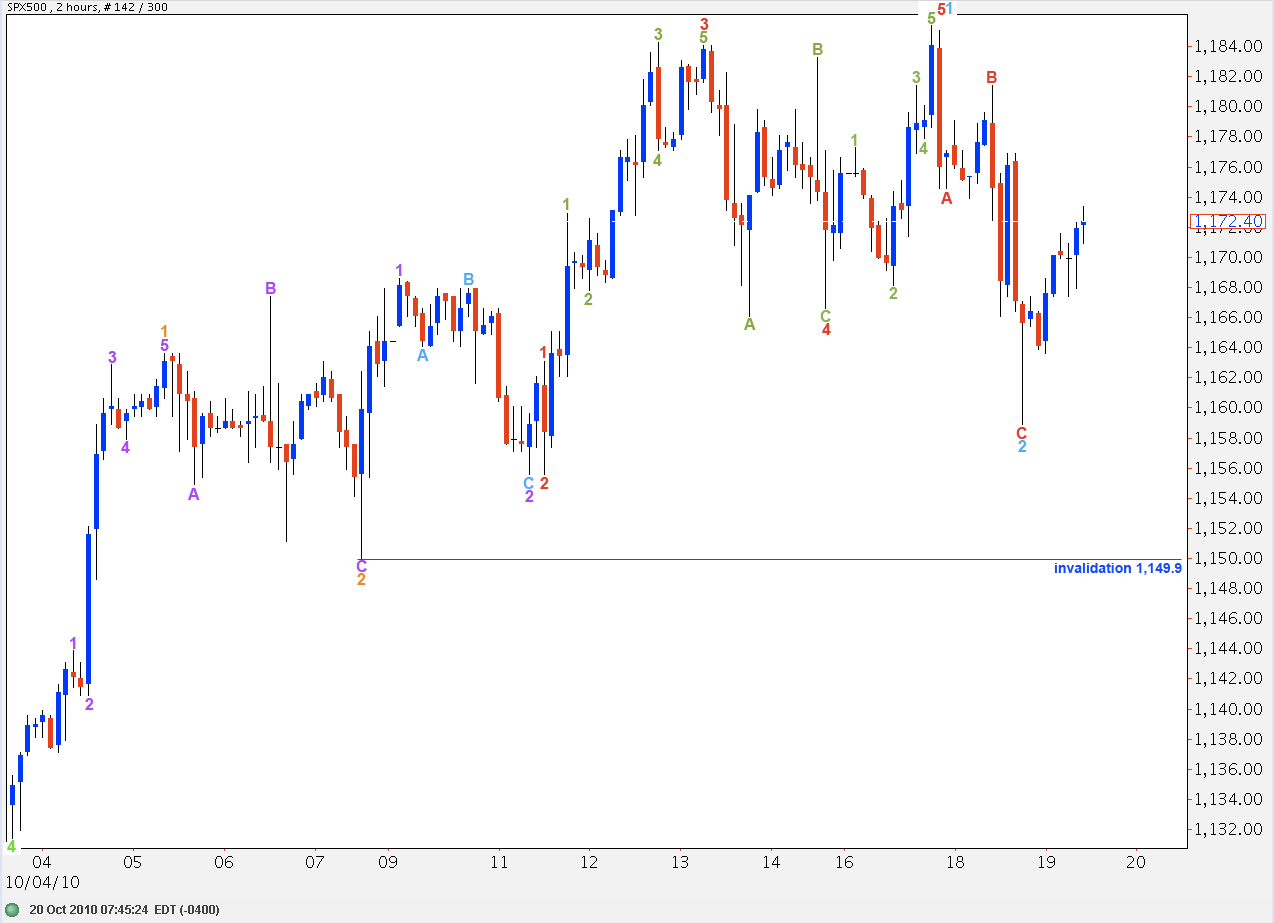
This alternate wave count details all of green wave 5 to end pink wave C on a 2 hourly chart.
By moving the labeling for more recent movement since the end of orange wave 2 down one degree we can see it is possible for the S&P to yet make new highs.
This wave count expects imminent strong upwards movement in a third wave which must reach to a new high above 1,185.4. When wave 3 orange is over then a fourth wave should follow which does not move below 1,163.6.
Because this wave count requires such significant upwards movement, if the main wave count is invalidated, we can expect price to reach just below to 1,220. Edit: the maximum allowable limit for upwards movement, if green labels 3 and 4 on the daily chart are correct, is to 1,198.7.
aah yes you are right it could still be 1-2, 1-2. I took a short earlier today but got stopped out 🙁 , at break even luckily.
Looks like were going higher. The move down on the Eur/usd now looks like a zigzag. So this means another 5 waves up if im right.
The euro has stopped short of the invalidation point. Because we have a big trend channel breach there I am fairly confident the euro has turned. I would expect it to start down shortly, but if I’m wrong the risk to a short entry is very small at this stage. That’s a risk I’m going to take today 🙂
Lara,does the small notation with green dot in bottom left hand corner of your hourly chart indicating 7am EDT also coincide exactly with the last hourly price bar on your chart, i.e., price bar closing at 7am?
Yes, it does
Lara,
Have you changed the labeling at green degree? The reason I ask is I thought that green 3 was shorter than green 1, which would mean that green 5 must be shorter than green 3, and upwards movement would be limited to approximately 1197. Thanks.
Peter
Yes Peter, again you are absolutely right. An error on my part. I seem to have a mental block with this one. Upwards movement (if the green labels are correct) is limited to 1,198.7. This wave count is looking so very unlikely though. I’ll update the article now.
Lara,
Actually, unless my data is incorrect, it looks like the main wave count has now been invalidated. I know you cannot update in real time, but are you thinking that there is an alternate other than the one you presented today that could explain today’s movement.
Thanks,
Peter
If i have time I’ll provide a quick updated chart. I can see an expanding leading diagonal, that five wave structure which began at 1,184.1. If this is correct then this is the invalidation point, 1,184.1 and price should turn down before that. At this stage upwards movement has a corrective count of 7 so that fits with this idea.
Otherwise the alternate wave count published today is correct.
It’s very important to note though that we still do not have confirmation today of a trend change for the S&P. There is still a fair amount of risk in entering short positions here, trying to pick the top too often can kill your account. However if your account is healthy and you want to take a small risk it’s running out of upwards room to move anyway. The end is nigh!
Lara,
Thanks. I know it is alot to follow intraday, but we are at such a critical juncture that your insight is very helpful. I have been trying to leg in short, with tight stops, and have of course been stopped out a few times. However, if we continue higher, the risk reward looks even better.
Peter