
Elliott Wave chart analysis for the SPX500 for 18th October, 2010. Please click on the charts below to enlarge.
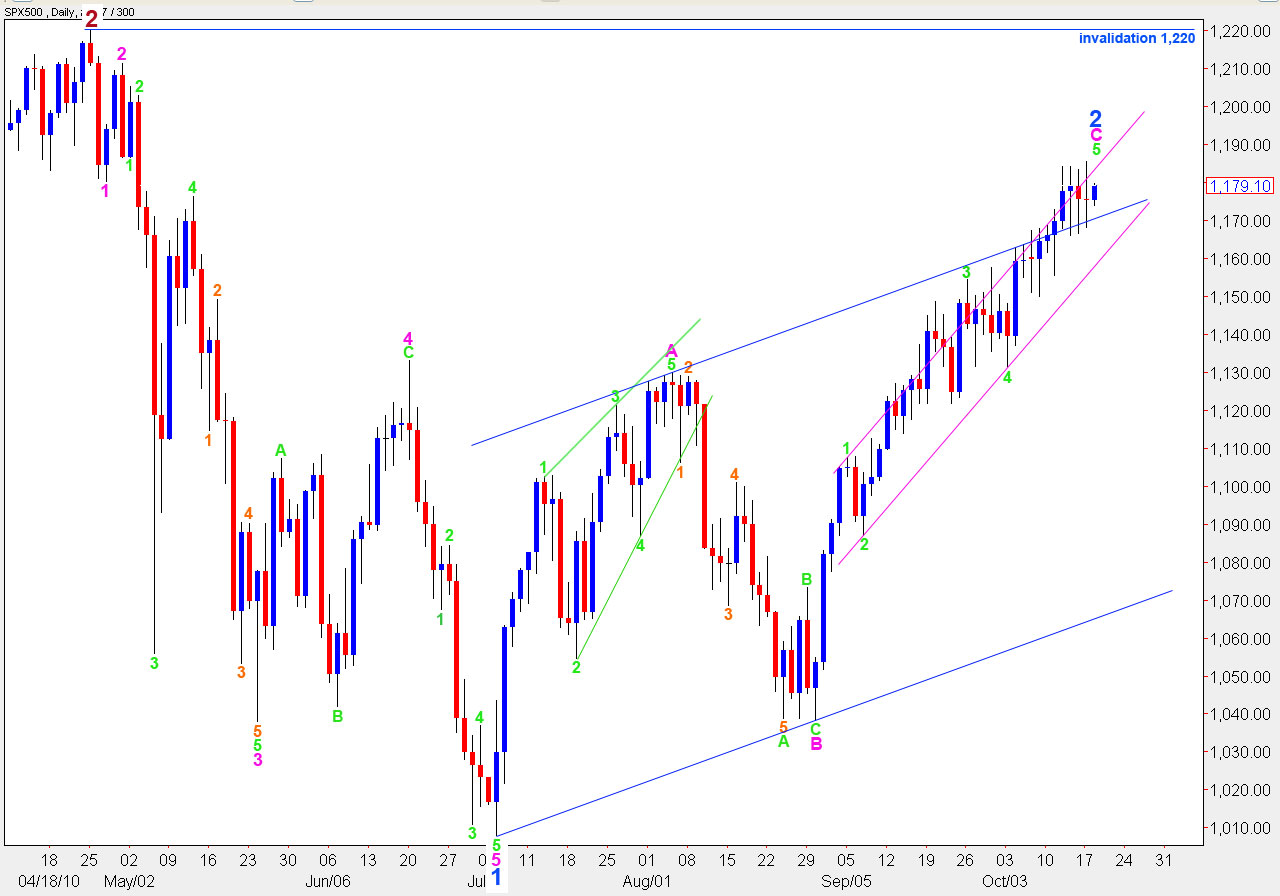
Yesterday’s upwards movement to a new high may again have ended this second wave correction. If it was over at 1,185.4 on the 17th of October then wave C pink was 35 days in duration, just one day longer than a fibonacci 34 which is an acceptable deviation.
I have two wave counts for you again today. Upwards movement may be over with the high of 1,185.4 as we can see a complete structure for wave 5 green of wave C pink. Alternatively, I can see a wave count which requires further upwards movement.
We need to see a full candlestick below the lower edge of the smaller pink parallel channel drawn using Elliott’s technique about wave C pink to confirm a trend change at minor degree.
Any further upwards movement should not move above 1,220 as wave 2 blue cannot move beyond the start of wave 1 blue.
Main Wave Count
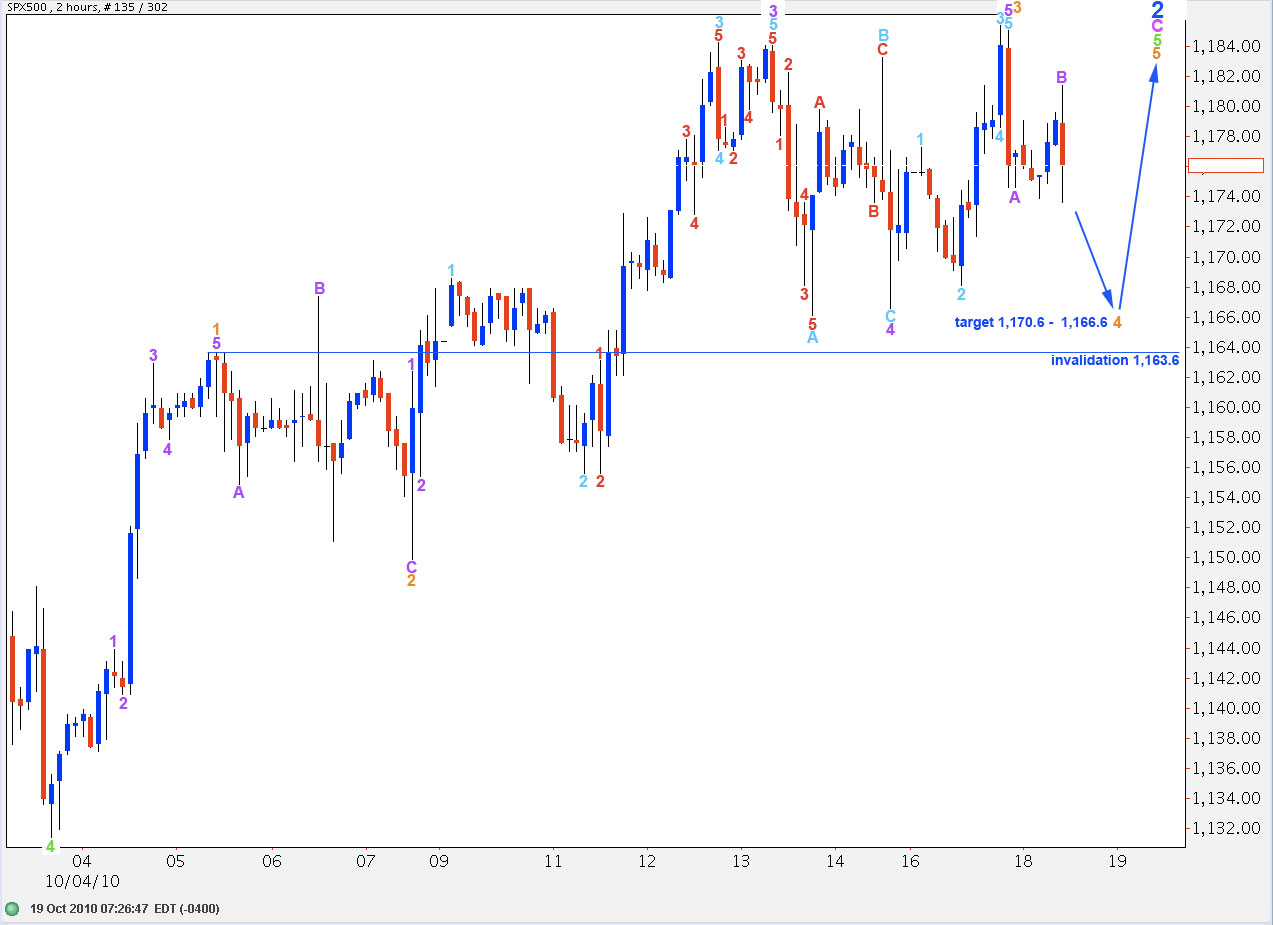
This wave count on a 2 hourly chart shows all of wave 5 green.
This wave count expects one more upwards push, most likely to a new high, before a trend change.
Within wave 5 green, wave 3 orange is just 3.3 points longer than equality with wave 1 orange. When we know the end to this wave 4 orange correction then a target for wave 5 orange, and the end to upwards movement, can be calculated. Wave 5 orange is likely to be 0.618 the length of wave 1 orange which is 20 points in length.
At 1,170.6 wave C purple of wave 4 orange will reach equality with wave A purple. At 1,166.6 wave 4 orange will correct to the fourth wave of one lesser degree (4 purple). This is the target zone for downwards movement for wave 4 orange.
Thereafter, expect further upwards movement in a five wave structure for wave 5 orange to end this second wave correction at minor (blue) degree.
Because wave 4 orange cannot move into wave 1 orange price territory this downwards correction may not move below 1,163.6
Alternate Wave Count
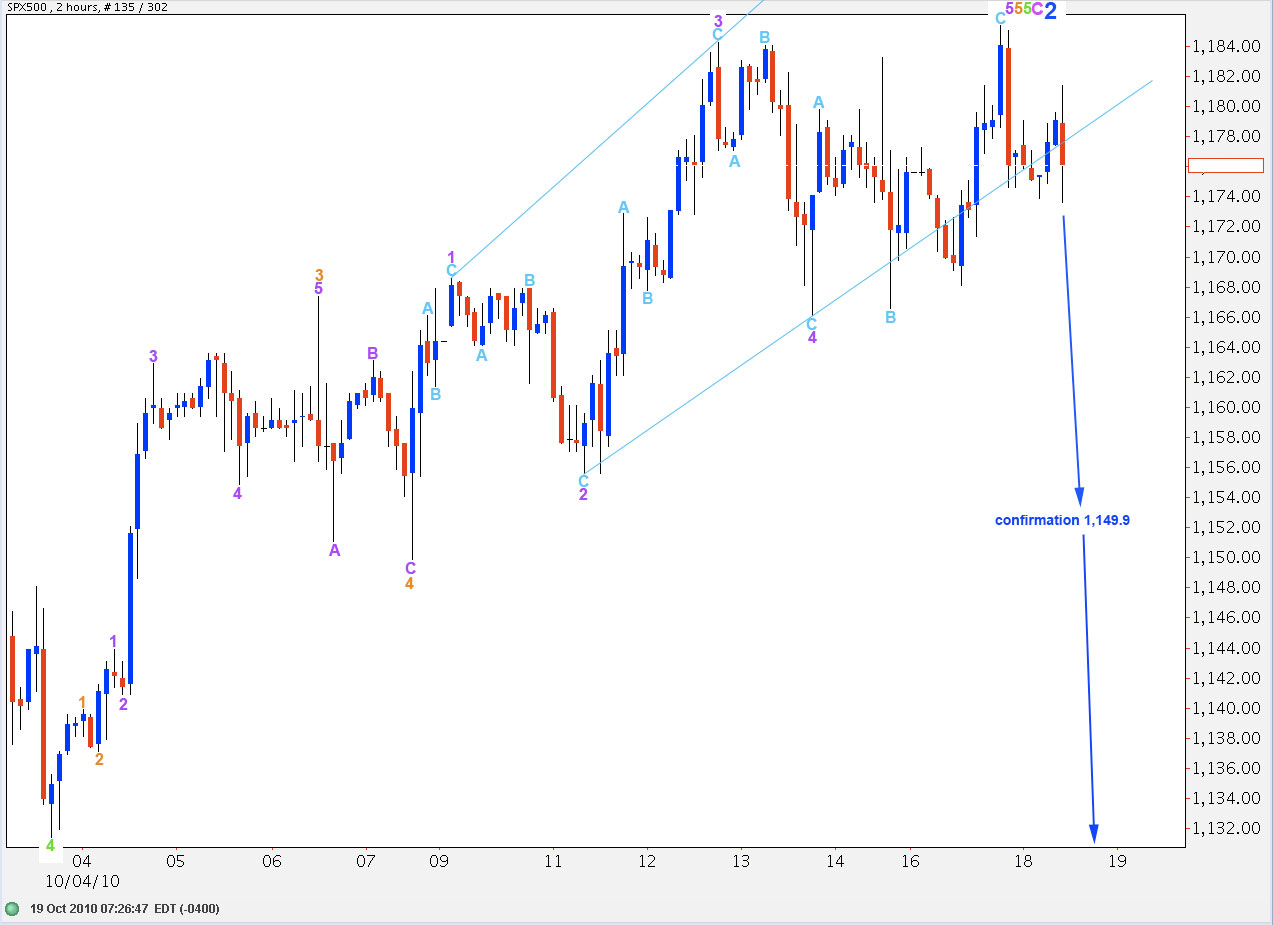
Upwards movement may be over. This wave count has an ending expanding diagonal to end wave 5 orange.
If this wave count is correct ratios are:
Pink wave C is 25.1 points longer than pink wave A and has no fibonacci ratio to A.
Ratios at green degree are: wave 3 green is just 1.9 points short of equality with wave 1 green and green wave 5 has no fibonacci ratio to either 3 or 1.
Ratios at orange degree within green wave 5 are: orange wave 3 has no fibonacci ratio to wave 1 but wave 5 is just 0.5 points short of 4.236 the length of wave 1.
Wave 5 orange is an ending expanding diagonal: wave 4 purple is longer than wave 2 purple, wave 3 purple is longer than wave 1 purple, but wave 5 purple is not longer than wave 3 purple. Wave 5 purple is longer than wave 1 purple and wave 3 purple is the longest. This is acceptable (please refer to figure 1-18, pg 39, Chapter 1 – The Broad Concept of “Elliott Wave Principle” by Frost and Prechter).
If upwards movement is over we need confirmation of a trend change by a breach of the trend channel on the daily chart. Price movement below 1,149.9 will eliminate the possibility of alternates which may see an extension of wave 5 orange as any second wave correction within it cannot move beyond the start of it’s first wave.
Thank you so much Lara.
It is an interesting experience for me in that as we approach this turning point, my investment friends are ever more convinced of new highs!
I have observed enough EW now to have strong confidence in the downturn I believe is so close right now.
Thanks for all you do and all your hard work as it is greatly appreciated.
I hope your time in Texas is going well.
John
I’m pretty confident that it’s just turned at this stage. I’ve just finished analysis of the euro and pound and they both have strong downturns, I’m very confident the pound is in a new trend down today. So it’s likely that the S&P has turned at this time in an “all the same markets” scenario.
I tried telling friends of my analysis of the NZ property market in 2007, I was expecting a downturn, but they looked at me as if I was stupid. They bought right at the peak. Oh dear. Unfortunately EW is contrarian, and exactly when you should be selling is when most people will buy and vice versa. You really cannot share this information with non technical analysts as they will consistently tell you that you are wrong.
I’m having a great time in Texas, it’s nice to come into warmth after our New Zealand winter. When I get back to NZ it will be summer there 🙂 Hopefully there will be waves for me too