
Elliott Wave chart analysis for the SPX500 for 15th October, 2010. Please click on the charts below to enlarge.
Friday’s downwards movement was not deep enough to provide confirmation of a trend change. We still have the two wave counts for the S&P to end the trading week.
One more day’s upwards movement would see wave C pink still with a fibonacci time relationship. If the high does not occur then the next opportunity for a fibonacci time relationship would be in another 21 trading days. This seems highly unlikely.
We can see reasonable divergence between price trending higher and MACD trending lower on 2 and 8 hourly charts for wave C pink. This trend is expiring.
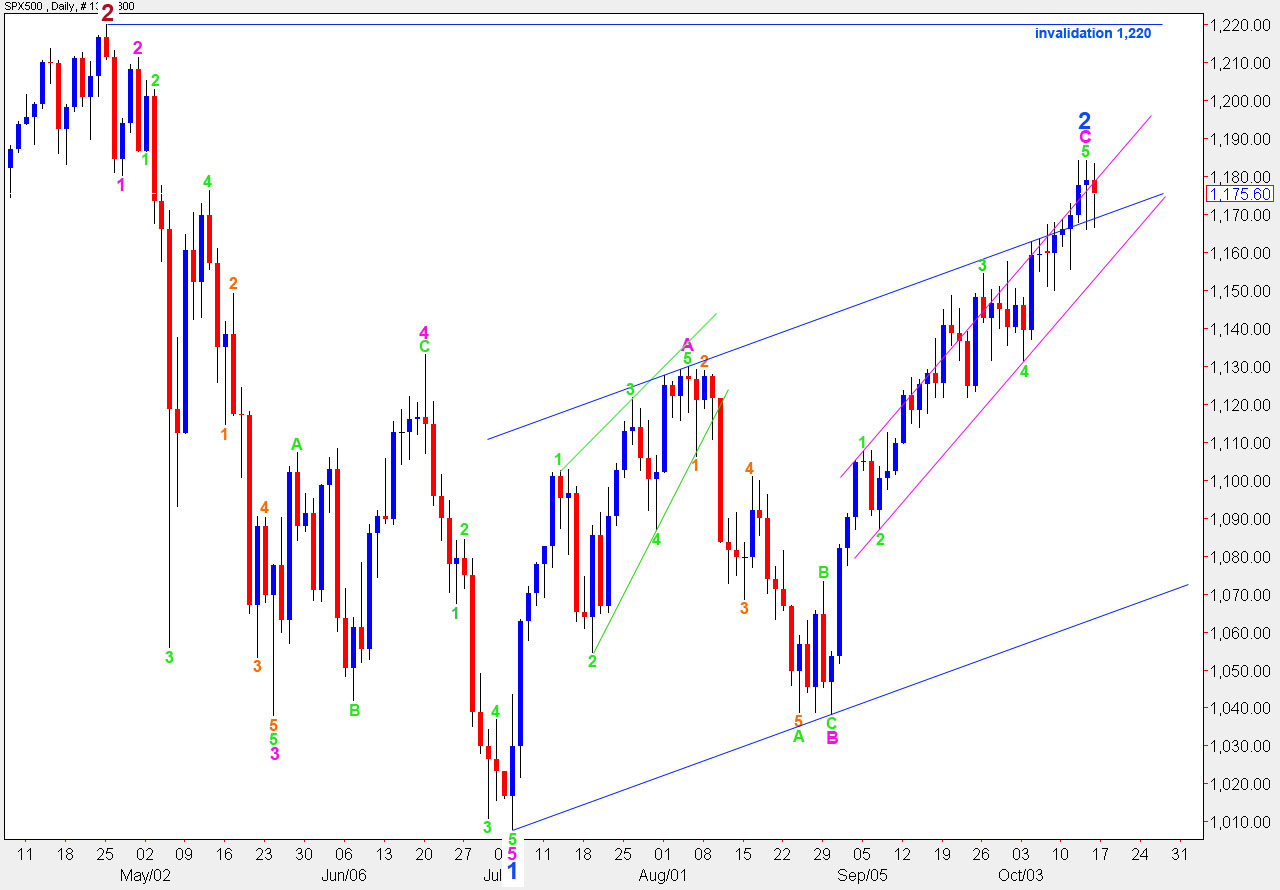
To confirm a trend change at minor degree we need to see a full candlestick below the small pink parallel trend channel on the daily chart. Price movement below 1,131.4 will provide further confirmation of a trend change but this will most likely come after a trend channel breach which is significant enough to provide confirmation on it’s own.
Main Wave Count
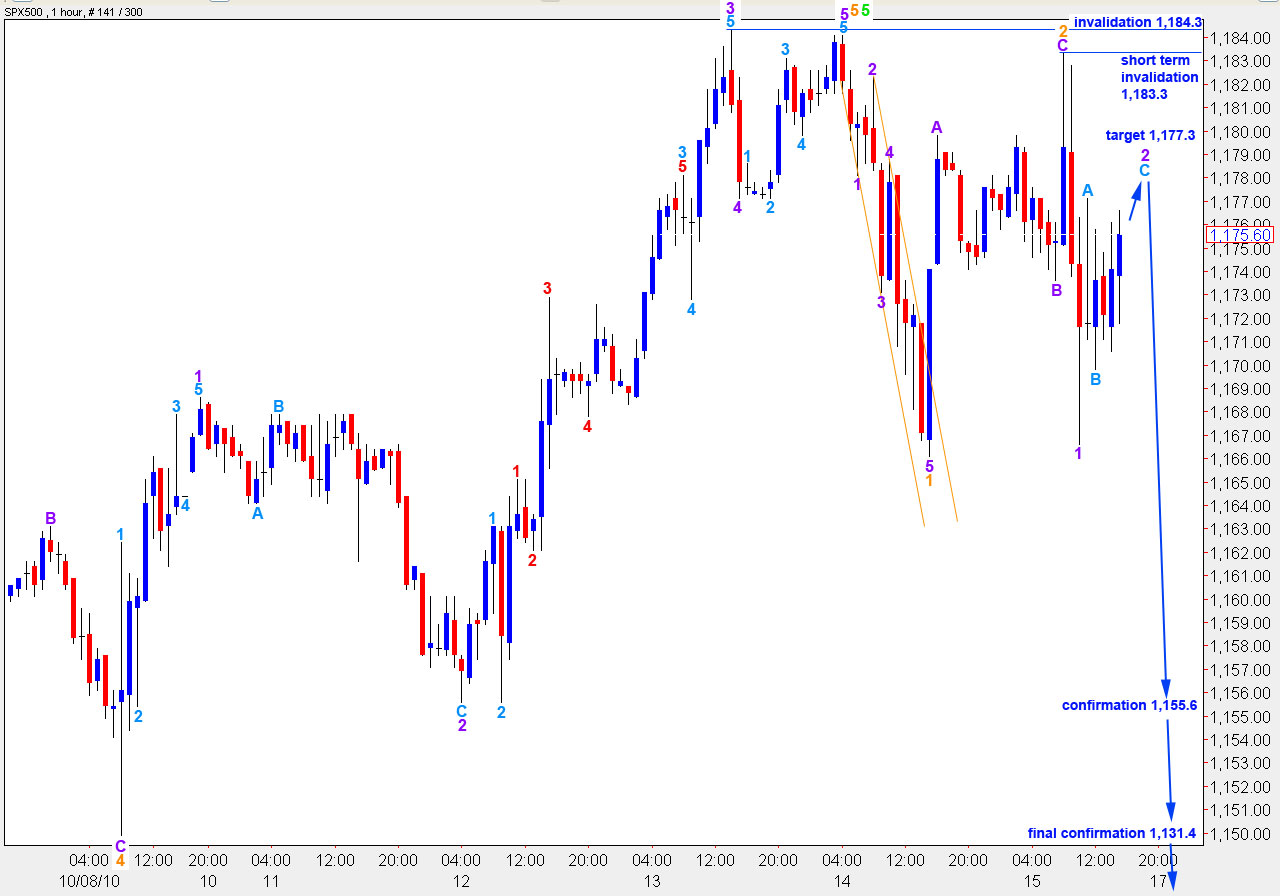
The main wave count expected upwards movement to 1,182.1 to end a second wave correction. This upwards movement ended just 1.2 points above the target. Thereafter, price turned back downwards.
Ratios within wave 2 orange are: wave B purple is a 45% correction of wave A purple and wave C purple is just 1.2 points longer than 0.618 the length of wave A purple.
Within wave 3 orange downwards the S&P should open slightly higher to complete wave C aqua of wave 2 purple. A target for the end to wave 2 purple is at 1,177.3. Upwards movement should not move above 1,183.3 as wave 2 purple cannot move beyond the start of wave 1 purple.
Thereafter, if this wave count is correct, the S&P should turn strongly downwards.
If upwards movement moves above 1,184.3 this wave count will be invalid. The alternate wave count will then explain movement.
Alternate Wave Count
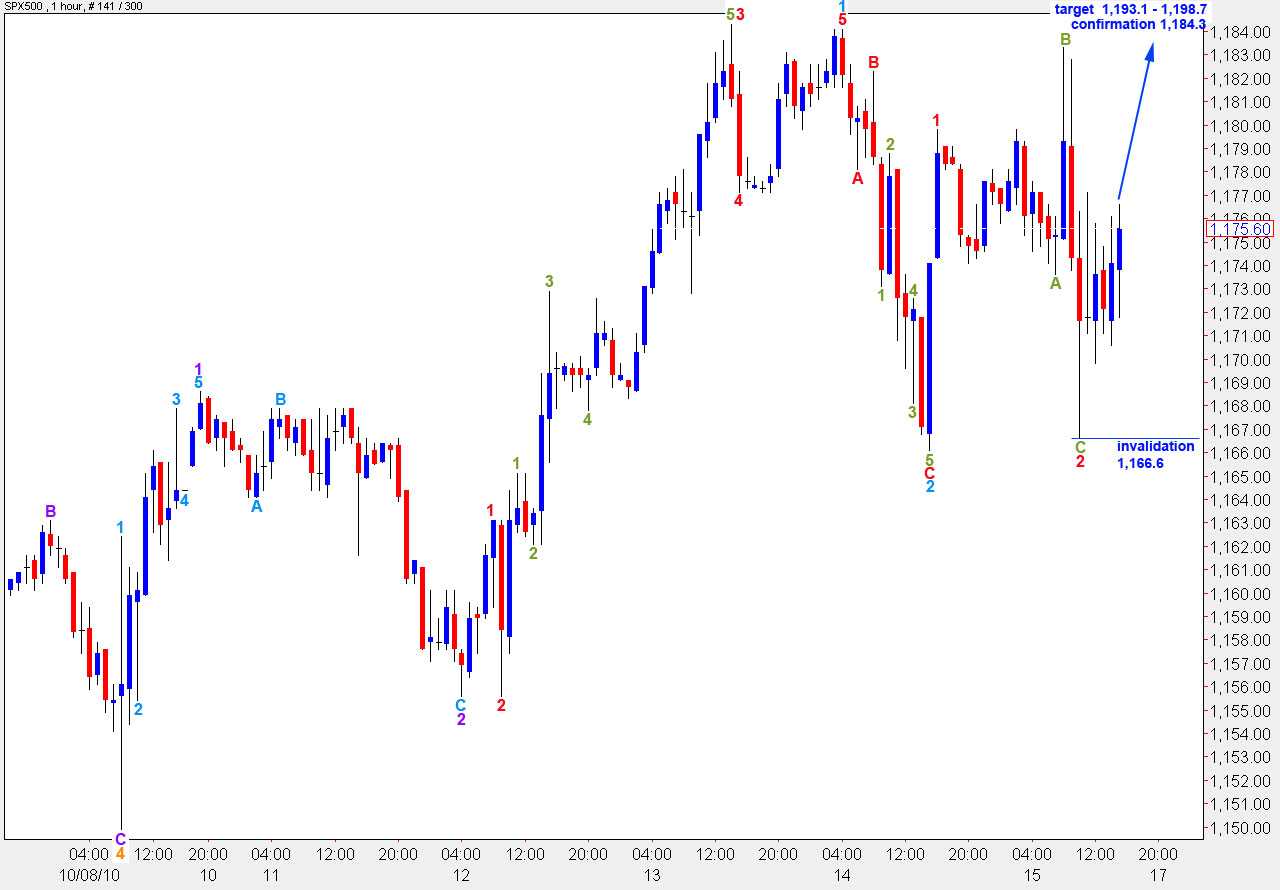
The alternate wave count is still valid. While price remains within the pink parallel channel on the daily chart further upwards movement to new highs will remain a possibility.
Recent movement can be counted as an expanded flat correction for wave 2 red. Ratios within wave 2 red are: wave B olive is a 156% correction of wave A olive and wave C olive is just 0.5 points longer than 2.618 the length of wave A olive.
If this wave count is correct price should not move below 1,166.6. Movement below this point will invalidate this wave count but it is not confirmation of a trend change at minor degree.
A third wave to the upside should quickly take price to new highs above 1,184.3. At this point this wave count would be confirmed.
At 1,193.1 wave 5 orange will reach 4.236 the length of wave 1 orange.
At 1,198.7 wave 5 green will reach equality with wave 3 green, which is also a maximum allowable upwards limit for this wave count.
Oh, one other factor. I also like lara’s site because it provides a forum in which members can share ideas and communicate with each other through PM. Lara’s targets could be very useful for day traders i suspect, even though i am not a day trader.
I have lost a ton too before, but i do not call EW analysis completely useless, because of that. I find lara’s approach unique and useful in the sense that she does not dabble in any other kind of analysis, including analysing news. The fact that she stays away from reading news makes her a unique and rare technician. I use lara’s targets and invalidations still useful, and incorporate them in my own TA. It is more dangerous to follow EW analysis when the technician is not fully aware of all the nuances of the theroy and when the technician does not know which wave structures and labelling holds more potential to be right. I am still bullish, but will be taking profits starting week, as we are approaching danger territory beyond spx 1200. I also find lara’s inclusion of USD analysis here very useful, as that confirms the trends in spx.
Great analysis as usual, Lara. Took 2 small short positions last week based on your excellent targets, invalidations and awve counts and made money on both. Had to do something to keep the trading muscle in shape and your stuff was the key.
Am sitting flat tonight as we appear to be at critical juncture. Cant wait for fireworks to begin.
I noticed tonight also , just as an aside , that Tim Knight, a prolific trader, technical analysis author and host of the most widely followed trader blog in the US, has disavowed EW completly as a trading tool in his latest post at slopeofhope.com. Obviously, from his post, he has not yet found our Kiwi gal! :).
Cheers.
For interested readers, here’s what Tim said:-
“I have finally set aside the Elliott Wave entirely as a predictive tool. Indeed, I would say that nothing has been more destructive to my own financial prosperity over my lifetime than the attention I have paid to this method. I know there are other prognosticators besides EWI, but I find them all collectively to be just noise.”
That’s probably because EW analysis has a tendency to call tops and bottoms too early. As soon as the structure is complete then it can turn, but it can be complete pretty early on in a wave. That is why I use trend channeling to confirm a trend change and alternates to understand other possibilities. The proper way to use EW analysis is with all possible alternates, but many traders new to EW would not be able to cope with that much information, it could induce paralysis by analysis. That’s why I will only produce two alternates at any one time, but I am charting and keeping track of others often also.
I expect he was using EW without trend channeling, or without running alternates alongside his main count. That’s why it did not work for him. That’s pretty common.
I’m glad you’re making $$ Michael. I’m still waiting for that euro to turn before I jump in there 🙂 I’m an extremely conservative trader though.