
Elliott Wave chart analysis for the SPX500 for 14th October, 2010. Please click on the charts below to enlarge.
Yesterday’s downwards movement invalidated the main wave count and gave initial confirmation of the alternate wave count. We do not have confirmation that wave 2 blue is over, however.
I have two wave counts again for you today. It is possible that we have a high in place; this is the main wave count. However, while price remains above 1,131.4 it is possible that we may yet see new highs. For this reason I have an alternate that requires further upwards movement.
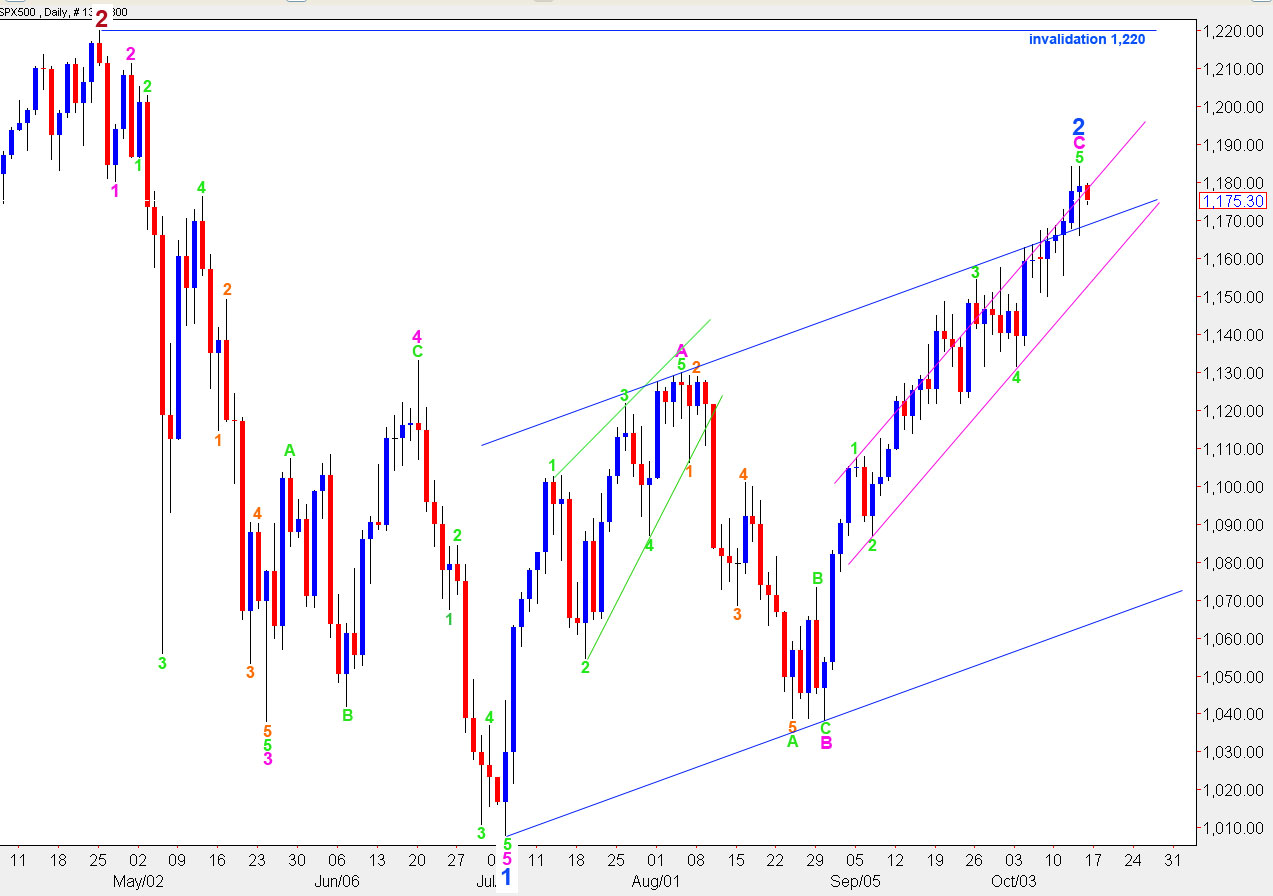
We should assume that the trend remains up until a trend change is confirmed. If trading to the upside we must exercise caution and always use stops because we are within the end of a terminal C wave (pink).
If upwards movement was over at the high of 1,184.1 then wave C pink lasted 33 days, just one day short of a fibonacci 34. Wave C pink is 24 points longer than wave A pink which is too much off equality to say they have an equal relationship.
Within wave C pink, wave 3 green was just 1.9 points short of equality with wave 1 green and wave 5 green was exactly 0.786 the length of wave 3 green.
Movement above 1,184.3 will indicate significant further upwards movement to come.
Movement below 1,155.6 will indicate an increased probability of a high in place.
Confirmation of a trend change and the start of wave 3 blue will come with a full candlestick sitting outside the lower edge of the pink parallel trend channel drawn here on the daily chart. Final confirmation will come with price movement below 1,131.4.
Main Wave Count
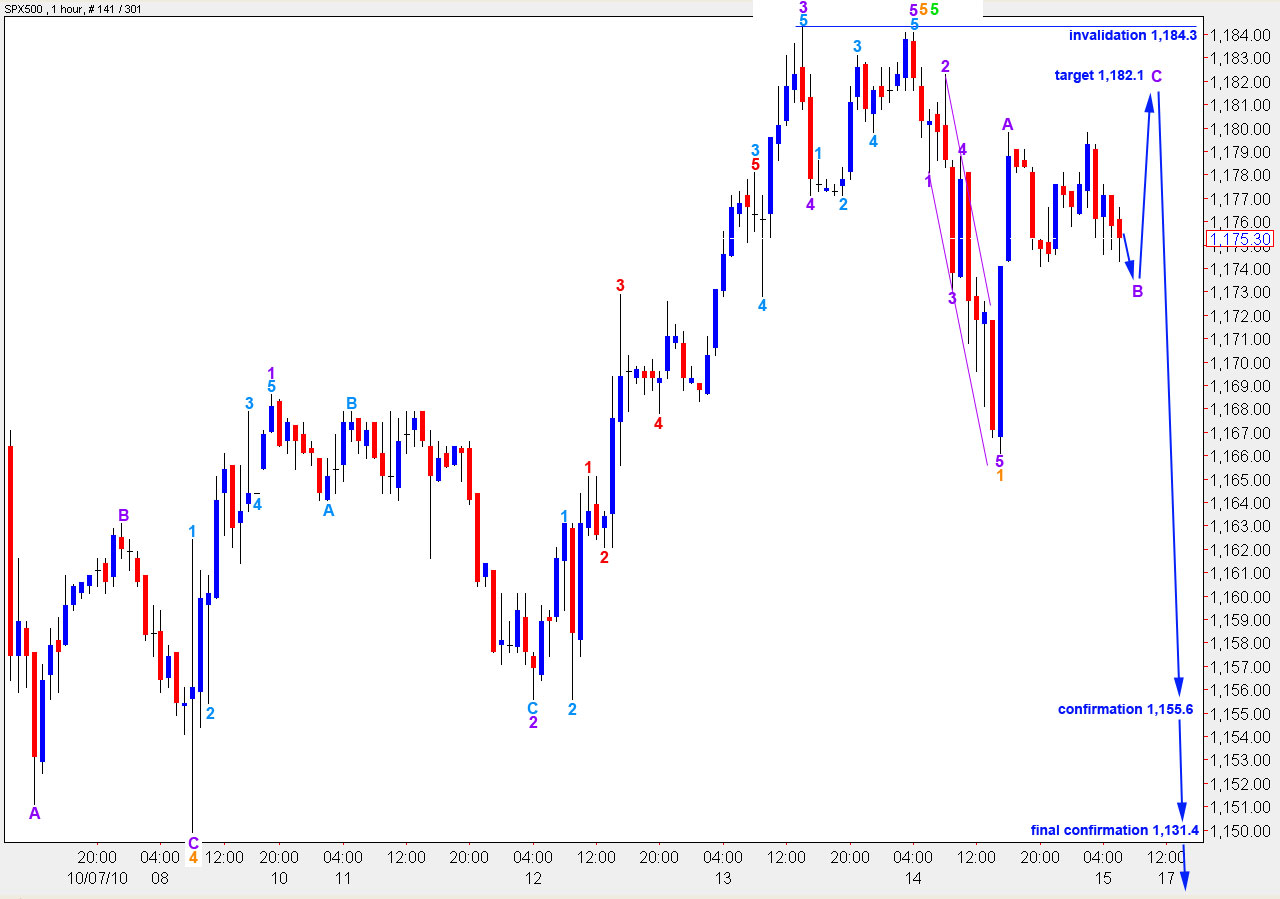
Yesterday’s downwards movement provided initial confirmation of this wave count. The only reservation I have with this count is the very slightly truncated fifth wave at purple degree to end wave 5 orange. All subdivisions are correct and this wave count has some excellent fibonacci ratios in both time and price.
Yesterday’s downwards movement may be seen as a leading diagonal for a first wave. On a 5 minute chart subwaves 2 through to 5 may be counted as zigzags which is allowable for a leading diagonal. Wave lengths are correct for an expanding diagonal.
Subsequent sideways movement is most likely a B wave. The market has moved higher since this chart was done; wave C to end this correction is completing. The target for wave C is where it will reach 0.618 the length of wave A purple.
When this correction is complete the next move should be down for a third wave at purple degree.
Confirmation of this wave count will come with movement below 1,155.6 as a second wave correction cannot move beyond the start of wave 1 purple.
Final confirmation of the trend change will come with movement below 1,131.4 as any correction within wave 5 green cannot move beyond the start of it.
Movement above 1,184.3 (I am being conservative in this point, 1,181.1 is the correct invalidation point) will invalidate this wave count and confirm our alternate.
Alternate Wave Count
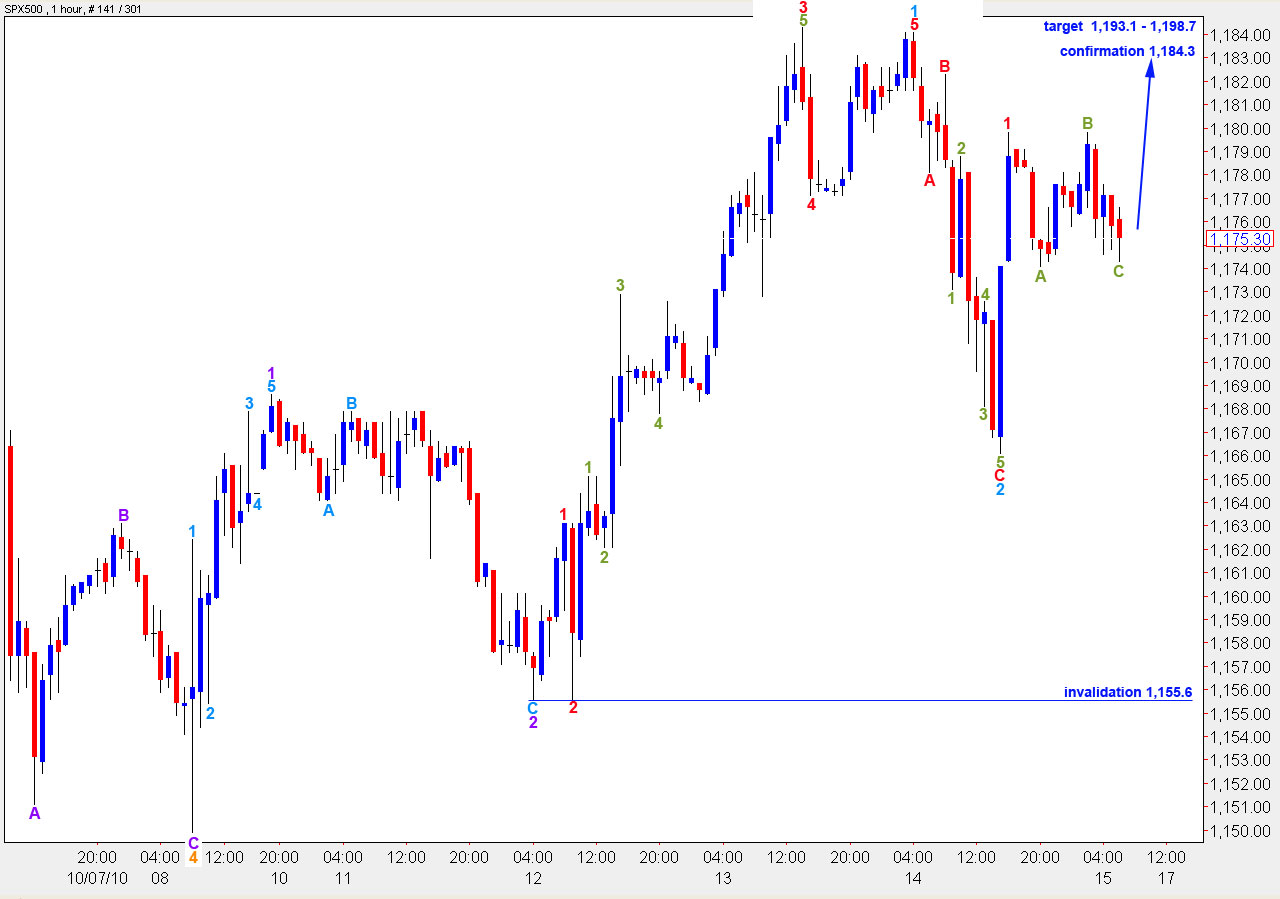
This wave count expects significant upwards movement.
This wave count is mostly similar to the main wave count. The biggest difference is that the degree of labeling here for the last upwards wave has been moved down one degree.
According to this wave count the S&P is in a third wave upwards.
At 1,193.1 wave 5 orange will reach 4.236 the length of wave 1 orange. At 1,198.7 wave 5 green will reach equality with wave 3 green, which is also a maximum allowable upwards limit for this wave count.
i can really see a completed wave count for the eur.usd now, if im not mistaken, this should put downwards pressure on the indices.
Yes, so can I. I agree that the euro will probably turn first, they are highly likely to all go down together. However we don’t have a high for either the euro or the S&P confirmed, it’s too early to call it yet, and I can see alternate counts for both that allow for more upwards movement. I’m about to publish the euro very soon…