
Elliott Wave chart analysis for the SPX500 for 13th October, 2010. Please click on the charts below to enlarge.
Yesterday’s analysis expected further upwards movement but not as much as we got. The target set has been exceeded by 4.9 points.
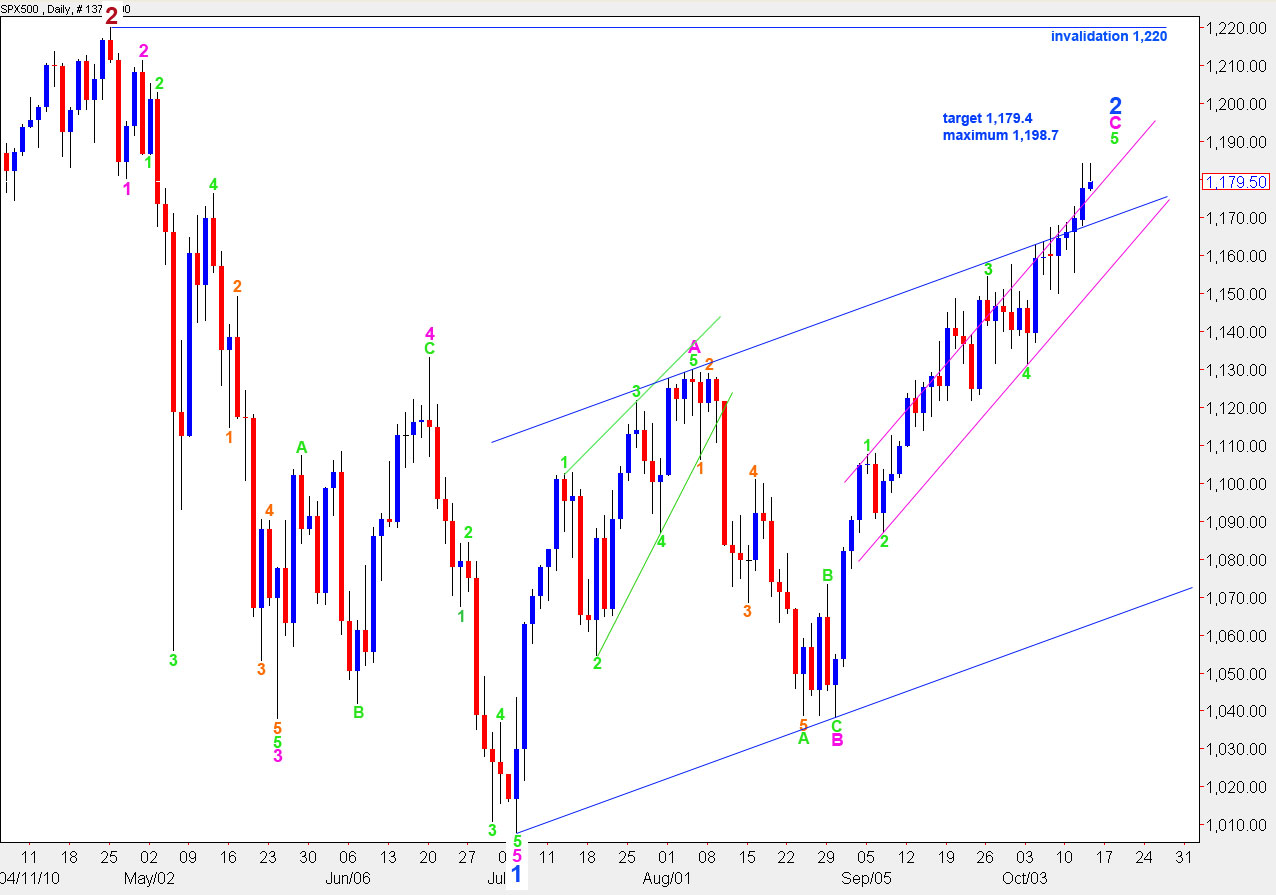
As we move closer to the end of this second wave correction we must exercise caution as the next move for the S&P is strong downwards movement in a third wave at minor (blue) degree of a first wave at intermediate (black) degree within a third wave at primary (maroon) degree. This next downwards movement could be very strong and fast when it finally arrives.
Again, we are at a critical junction. I can see a complete and satisfactory impulsive structure after yesterday’s movement; it could have been over there. Alternately price could make new highs. I have two wave counts for you with invalidation and confirmation points to work with.
Any further upwards movement cannot move above 1,220 as wave 2 blue cannot move beyond the start of wave 1 blue.
For this wave count within wave C pink upwards movement cannot move above 1,198.7 as wave 5 green cannot be longer than wave 3 green.
Main Wave Count
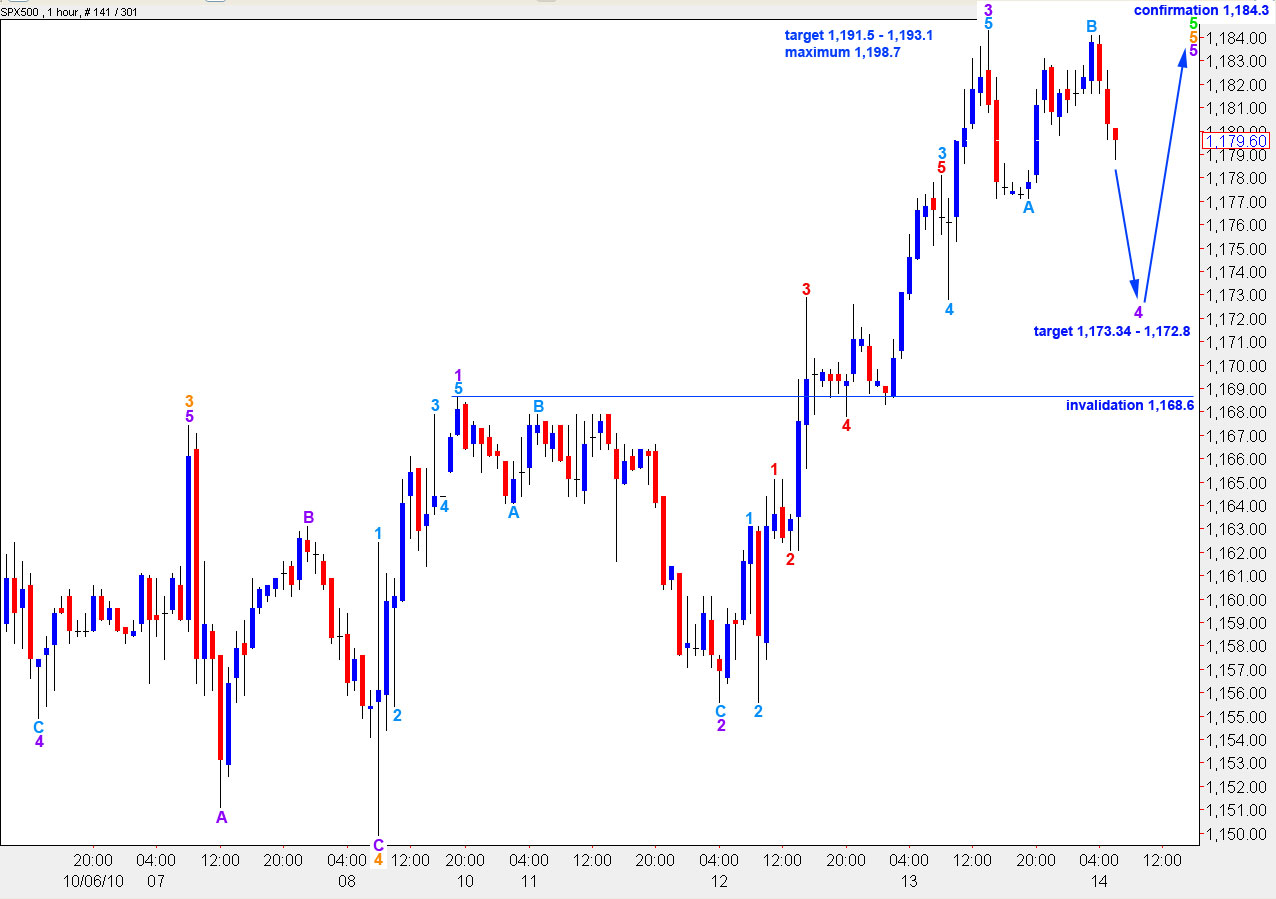
This main wave count sees one to three more days of upwards movement. If wave C pink is to have a fibonacci time relationship, one to three more days will bring it to 33 to 35 days duration which is an acceptable deviation from a fibonacci 34.
Ratios within wave C pink are: wave 3 green is just 1.9 points short of equality with wave 1 green.
Ratios within wave 5 green are: wave 3 orange is just 2.3 points longer than 2.618 the length of wave 1 orange. Wave 5 orange will reach 4.236 the length of wave 1 orange at 1,193.1. This is the upper edge of our target zone for this wave count.
Ratios within wave 5 orange within wave 5 green are: wave 3 purple is just 1.6 short of 1.618 the length of wave 1 purple.
Ratios within wave 3 purple are: wave 3 aqua is 2.9 points short of 2.618 the length of wave 1 aqua and wave 5 aqua is 2.9 points longer than 0.382 the length of wave 3 aqua.
Ratios within wave 3 aqua are: wave 3 red is 1.3 points longer than equality with wave 1 red and wave 5 red is just 0.5 points short of equality with wave 3 red.
We may expect wave 4 purple to correct to about the fourth wave of one lesser degree at 1,172.8 to the 0.382 fibonacci ratio for wave 3 purple at 1,173.34.
Wave 4 purple cannot move into wave 1 purple price territory. Therefore, price cannot move below 1,168.6. If that occurs we should use the alternate wave count below.
Alternate Wave Count
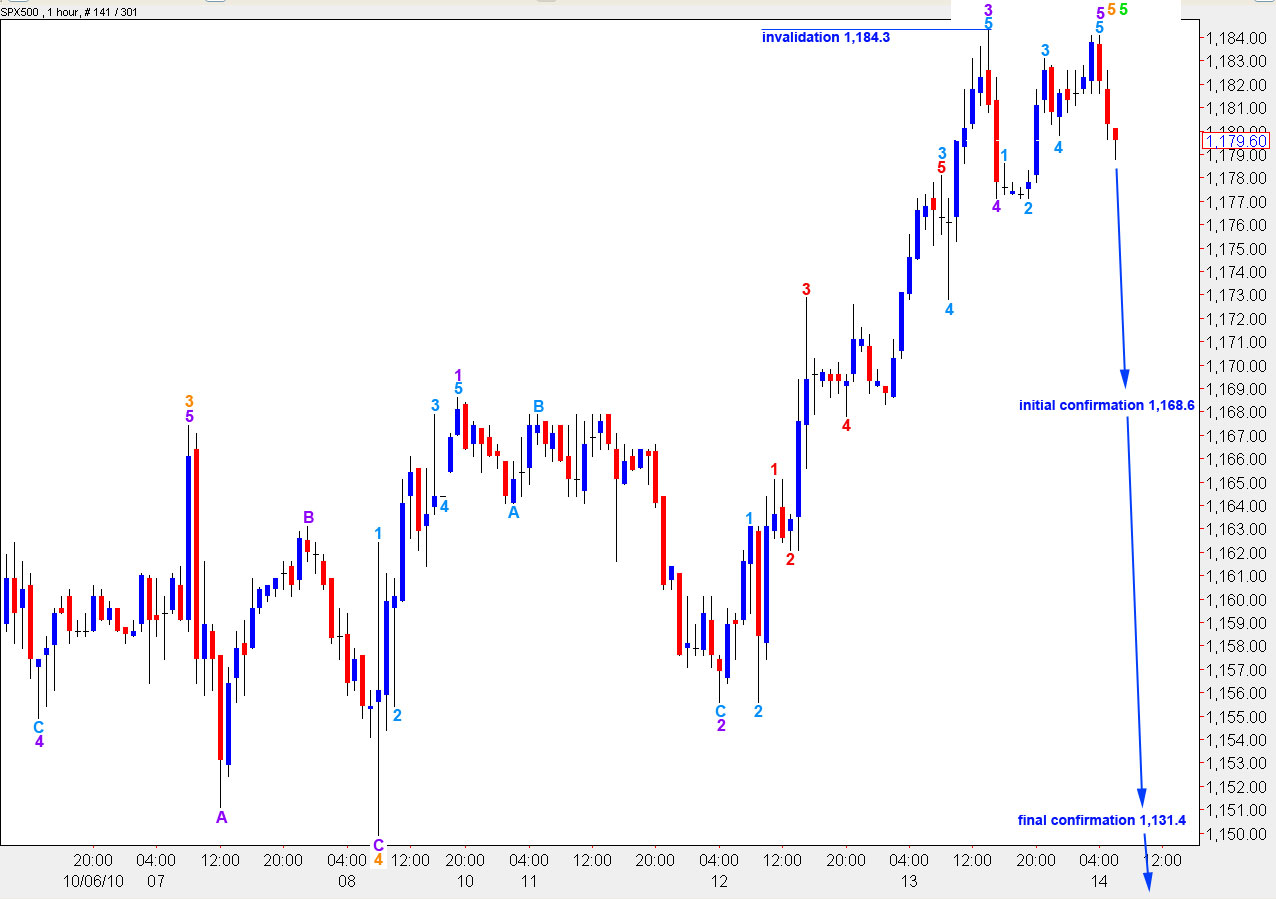
This alternate wave count sees a complete structure for upwards movement. The only problem within this wave count is the slightly truncated fifth wave to end upwards movement. This is technically possible but the probability of truncations is low.
If wave 2 blue was over yesterday then it has no fibonacci time relationship.
Within wave 2 blue there is no fibonacci relationship between A and C pink. Nor can there be now as C has passed equality with wave A and at 1.618 the length of A would be over 1,220 which is invalid for this wave count at minor and primary degree.
Within pink wave C ratios are: green wave 3 is just 1.9 points short of equality with green wave 1 and green wave 5 is exactly 0.786 the length of green wave 3 (which is strictly speaking not a fibonacci ratio but is commonly used in trading).
Within green wave 5 ratios are: orange wave 3 is 2.8 points longer than 2.618 the length of orange wave 1 and orange wave 5 is 4.9 points longer than equality with orange wave 3.
Within orange wave 5 ratios are: purple wave 3 is 1.6 longer than 1.618 the length of purple wave 1 and purple wave 5 is exactly 0.236 the length of purple wave 3.
Within purple wave 3 ratios are exactly the same as the main wave count.
If we see price move below 1,168.6 we will have our first indication that this may be the correct wave count. However, this is not confirmation of a big trend change.
When we see a full daily candlestick outside the pink parallel trend channel on the daily chart, and price movement below 1,131.4, then we will have confirmation that wave 2 blue is over and wave 3 blue is underway.
As wave 3 blue is likely to be longer than wave 1 blue, and must make a new low below 1,008, there is significant opportunity for profit. Patience in waiting for confirmation of this trend change will reduce losses in trying to pick the top.
Hi Lara-Really appreciate your rising to the occasion even while on vacay. You are a trooper.
The analysis is great.
What a trip this wave 2 has been. A true education in the complexities of corrective waves and combinations. It’s difficult to trust that it is near completing. (-:
Thanks you for your sustained and insightful efforts.
Very best regards,
Robert Jackson